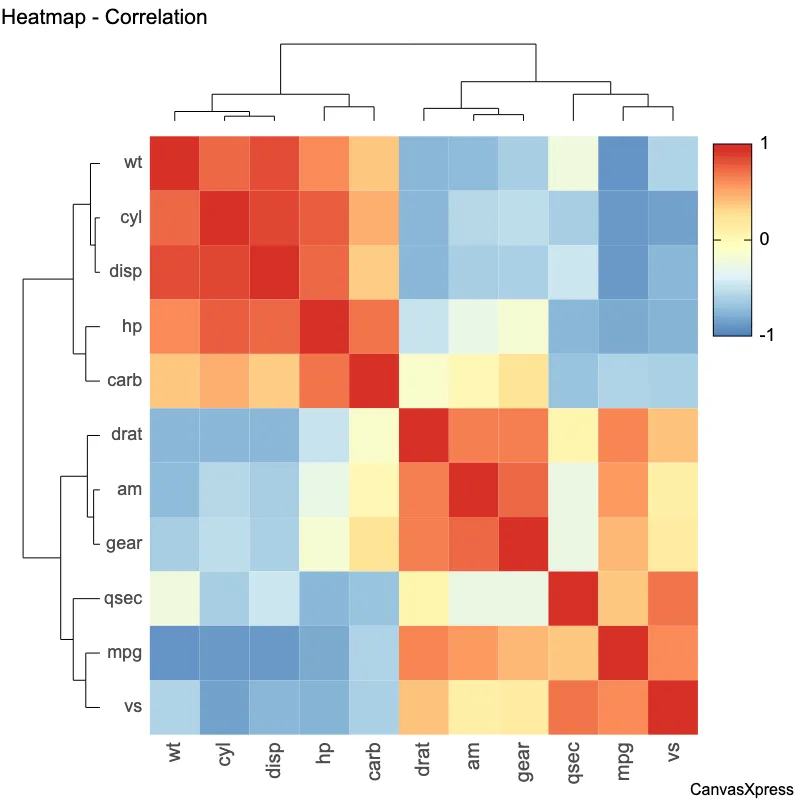
Visualizing correlations in mtcars data
Correlation graphs are visual representations of the relationship between two or more variables. They help identify trends and patterns, showing whether variables move together (positive correlation), in opposite directions (negative correlation), or have no relationship (no correlation). Common types include scatter plots and line graphs. Understanding correlation graphs is crucial for data analysis across various fields. From finance and economics to science and healthcare, they provide insights into dependencies and potential predictions. Interpreting the strength and direction of correlation is key to making informed decisions based on data. Effective visualization ensures clear communication of complex relationships.
<html>

  <head>
    <!-- Include the CanvasXpress library in your HTML file -->
    <link rel="stylesheet" href="https://www.canvasxpress.org/dist/canvasXpress.css" type="text/css"/>
    <script src="https://www.canvasxpress.org/dist/canvasXpress.min.js"></script>
  </head>

  <body>

    <!-- Create a canvas element for the chart with the desired dimensions -->
    <div>
      <canvas id="canvasId" width="600" height="600"></canvas>
    </div>


    <!-- Create a script to initialize the chart -->
    <script>

      // Use a data frame (2D-array) for the graph
      var data = [
        [ "Id", "mpg", "cyl", "disp", "hp", "drat", "wt", "qsec", "vs", "am", "gear", "carb"],
        [ "Mazda RX4", 21, 6, 160, 110, 3.9, 2.62, 16.46, 0, 1, 4, 4],
        [ "Mazda RX4 Wag", 21, 6, 160, 110, 3.9, 2.875, 17.02, 0, 1, 4, 4],
        [ "Datsun 710", 22.8, 4, 108, 93, 3.85, 2.32, 18.61, 1, 1, 4, 1],
        [ "Hornet 4 Drive", 21.4, 6, 258, 110, 3.08, 3.215, 19.44, 1, 0, 3, 1],
        [ "Hornet Sportabout", 18.7, 8, 360, 175, 3.15, 3.44, 17.02, 0, 0, 3, 2],
        [ "Valiant", 18.1, 6, 225, 105, 2.76, 3.46, 20.22, 1, 0, 3, 1],
        [ "Duster 360", 14.3, 8, 360, 245, 3.21, 3.57, 15.84, 0, 0, 3, 4],
        [ "Merc 240D", 24.4, 4, 146.7, 62, 3.69, 3.19, 20, 1, 0, 4, 2],
        [ "Merc 230", 22.8, 4, 140.8, 95, 3.92, 3.15, 22.9, 1, 0, 4, 2],
        [ "Merc 280", 19.2, 6, 167.6, 123, 3.92, 3.44, 18.3, 1, 0, 4, 4],
        [ "Merc 280C", 17.8, 6, 167.6, 123, 3.92, 3.44, 18.9, 1, 0, 4, 4],
        [ "Merc 450SE", 16.4, 8, 275.8, 180, 3.07, 4.07, 17.4, 0, 0, 3, 3],
        [ "Merc 450SL", 17.3, 8, 275.8, 180, 3.07, 3.73, 17.6, 0, 0, 3, 3],
        [ "Merc 450SLC", 15.2, 8, 275.8, 180, 3.07, 3.78, 18, 0, 0, 3, 3],
        [ "Cadillac Fleetwood", 10.4, 8, 472, 205, 2.93, 5.25, 17.98, 0, 0, 3, 4],
        [ "Lincoln Continental", 10.4, 8, 460, 215, 3, 5.424, 17.82, 0, 0, 3, 4],
        [ "Chrysler Imperial", 14.7, 8, 440, 230, 3.23, 5.345, 17.42, 0, 0, 3, 4],
        [ "Fiat 128", 32.4, 4, 78.7, 66, 4.08, 2.2, 19.47, 1, 1, 4, 1],
        [ "Honda Civic", 30.4, 4, 75.7, 52, 4.93, 1.615, 18.52, 1, 1, 4, 2],
        [ "Toyota Corolla", 33.9, 4, 71.1, 65, 4.22, 1.835, 19.9, 1, 1, 4, 1],
        [ "Toyota Corona", 21.5, 4, 120.1, 97, 3.7, 2.465, 20.01, 1, 0, 3, 1],
        [ "Dodge Challenger", 15.5, 8, 318, 150, 2.76, 3.52, 16.87, 0, 0, 3, 2],
        [ "AMC Javelin", 15.2, 8, 304, 150, 3.15, 3.435, 17.3, 0, 0, 3, 2],
        [ "Camaro Z28", 13.3, 8, 350, 245, 3.73, 3.84, 15.41, 0, 0, 3, 4],
        [ "Pontiac Firebird", 19.2, 8, 400, 175, 3.08, 3.845, 17.05, 0, 0, 3, 2],
        [ "Fiat X1-9", 27.3, 4, 79, 66, 4.08, 1.935, 18.9, 1, 1, 4, 1],
        [ "Porsche 914-2", 26, 4, 120.3, 91, 4.43, 2.14, 16.7, 0, 1, 5, 2],
        [ "Lotus Europa", 30.4, 4, 95.1, 113, 3.77, 1.513, 16.9, 1, 1, 5, 2],
        // ... (data truncated after 29 records for clarity)
      ]

      // Create the configuration for the graph
      var config = {
         "graphType" : "Heatmap",
         "title" : "Heatmap - Correlation",
         "xAxis" : ["mpg","cyl","disp","hp","drat","wt","qsec","vs","am","gear","carb"]
      }

      // Event used to create graph (optional)
      var events = false


      // Call the CanvasXpress function to create the graph
      var cX = new CanvasXpress("canvasId", data, config, events);

      // Functions after rendering graph
      cX.createHeatmapCorrelation();
      cX.clusterVariables();
      cX.clusterSamples();

    </script>

  </body>

</html>
<html>

  <head>
    <!-- Include the CanvasXpress library in your HTML file -->
    <link rel="stylesheet" href="https://www.canvasxpress.org/dist/canvasXpress.css" type="text/css"/>
    <script src="https://www.canvasxpress.org/dist/canvasXpress.min.js"></script>
  </head>

  <body>

    <!-- Create a canvas element for the chart with the desired dimensions -->
    <div>
      <canvas id="canvasId" width="600" height="600"></canvas>
    </div>


    <!-- Create a script to initialize the chart -->
    <script>

      // Create the data for the graph
      var data = {
         "y" : {
            "data" : [
              [21,21,22.8,21.4,18.7,18.1,14.3,24.4,22.8,19.2,17.8,16.4,17.3,15.2,10.4,10.4,14.7,32.4,30.4,33.9,21.5,15.5,15.2,13.3,19.2,27.3,26,30.4,15.8,19.7,15,21.4],
              [6,6,4,6,8,6,8,4,4,6,6,8,8,8,8,8,8,4,4,4,4,8,8,8,8,4,4,4,8,6,8,4],
              [160,160,108,258,360,225,360,146.7,140.8,167.6,167.6,275.8,275.8,275.8,472,460,440,78.7,75.7,71.1,120.1,318,304,350,400,79,120.3,95.1,351,145,301,121],
              [110,110,93,110,175,105,245,62,95,123,123,180,180,180,205,215,230,66,52,65,97,150,150,245,175,66,91,113,264,175,335,109],
              [3.9,3.9,3.85,3.08,3.15,2.76,3.21,3.69,3.92,3.92,3.92,3.07,3.07,3.07,2.93,3,3.23,4.08,4.93,4.22,3.7,2.76,3.15,3.73,3.08,4.08,4.43,3.77,4.22,3.62,3.54,4.11],
              [2.62,2.875,2.32,3.215,3.44,3.46,3.57,3.19,3.15,3.44,3.44,4.07,3.73,3.78,5.25,5.424,5.345,2.2,1.615,1.835,2.465,3.52,3.435,3.84,3.845,1.935,2.14,1.513,3.17,2.77,3.57,2.78],
              [16.46,17.02,18.61,19.44,17.02,20.22,15.84,20,22.9,18.3,18.9,17.4,17.6,18,17.98,17.82,17.42,19.47,18.52,19.9,20.01,16.87,17.3,15.41,17.05,18.9,16.7,16.9,14.5,15.5,14.6,18.6],
              [0,0,1,1,0,1,0,1,1,1,1,0,0,0,0,0,0,1,1,1,1,0,0,0,0,1,0,1,0,0,0,1],
              [1,1,1,0,0,0,0,0,0,0,0,0,0,0,0,0,0,1,1,1,0,0,0,0,0,1,1,1,1,1,1,1],
              [4,4,4,3,3,3,3,4,4,4,4,3,3,3,3,3,3,4,4,4,3,3,3,3,3,4,5,5,5,5,5,4],
              [4,4,1,1,2,1,4,2,2,4,4,3,3,3,4,4,4,1,2,1,1,2,2,4,2,1,2,2,4,6,8,2]
            ],
            "smps" : ["Mazda RX4","Mazda RX4 Wag","Datsun 710","Hornet 4 Drive","Hornet Sportabout","Valiant","Duster 360","Merc 240D","Merc 230","Merc 280","Merc 280C","Merc 450SE","Merc 450SL","Merc 450SLC","Cadillac Fleetwood","Lincoln Continental","Chrysler Imperial","Fiat 128","Honda Civic","Toyota Corolla","Toyota Corona","Dodge Challenger","AMC Javelin","Camaro Z28","Pontiac Firebird","Fiat X1-9","Porsche 914-2","Lotus Europa","Ford Pantera L","Ferrari Dino","Maserati Bora","Volvo 142E"],
            "vars" : ["mpg","cyl","disp","hp","drat","wt","qsec","vs","am","gear","carb"]
         }
      }

      // Create the configuration for the graph
      var config = {
         "graphType" : "Heatmap",
         "title" : "Heatmap - Correlation",
         "xAxis" : ["mpg","cyl","disp","hp","drat","wt","qsec","vs","am","gear","carb"]
      }

      // Event used to create graph (optional)
      var events = false


      // Call the CanvasXpress function to create the graph
      var cX = new CanvasXpress("canvasId", data, config, events);

      // Functions after rendering graph
      cX.createHeatmapCorrelation();
      cX.clusterVariables();
      cX.clusterSamples();

    </script>

  </body>

</html>
library(canvasXpress)
y=read.table("https://www.canvasxpress.org/data/r/cX-mtcarst-dat.txt", header=TRUE, sep="\t", quote="", row.names=1, fill=TRUE, check.names=FALSE, stringsAsFactors=FALSE)
canvasXpress(
  data=y,
  graphType="Heatmap",
  title="Heatmap - Correlation",
  xAxis=list("mpg", "cyl", "disp", "hp", "drat", "wt", "qsec", "vs", "am", "gear", "carb"),
  afterRender=list(list("createHeatmapCorrelation"), list("clusterVariables"), list("clusterSamples"))
)


