The CanvasXpress Architecture
A chart is a grammar — one normalized spec drives every render.
Introduction
CanvasXpress is a mature, source-available visualization engine built for biomedical data and trusted in production. Under the hood it is organized around a single idea from the Grammar of Graphics: every chart is composed from the same small set of parts, so one vocabulary can build anything — a heatmap, a volcano plot, a Kaplan–Meier curve, a network, or a scatter plot. The same engine and the same grammar power the R, Python, Julia and JavaScript APIs, so a figure behaves identically no matter where it was created.
A Chart is a Grammar
Like ggplot2, a CanvasXpress figure is decomposed into composable layers. Each chart type is expressed as a coordinate system applied to one or more layers, where every layer is a geometry combined with a statistical transform and a position adjustment, over trained scales, optionally split into facets:
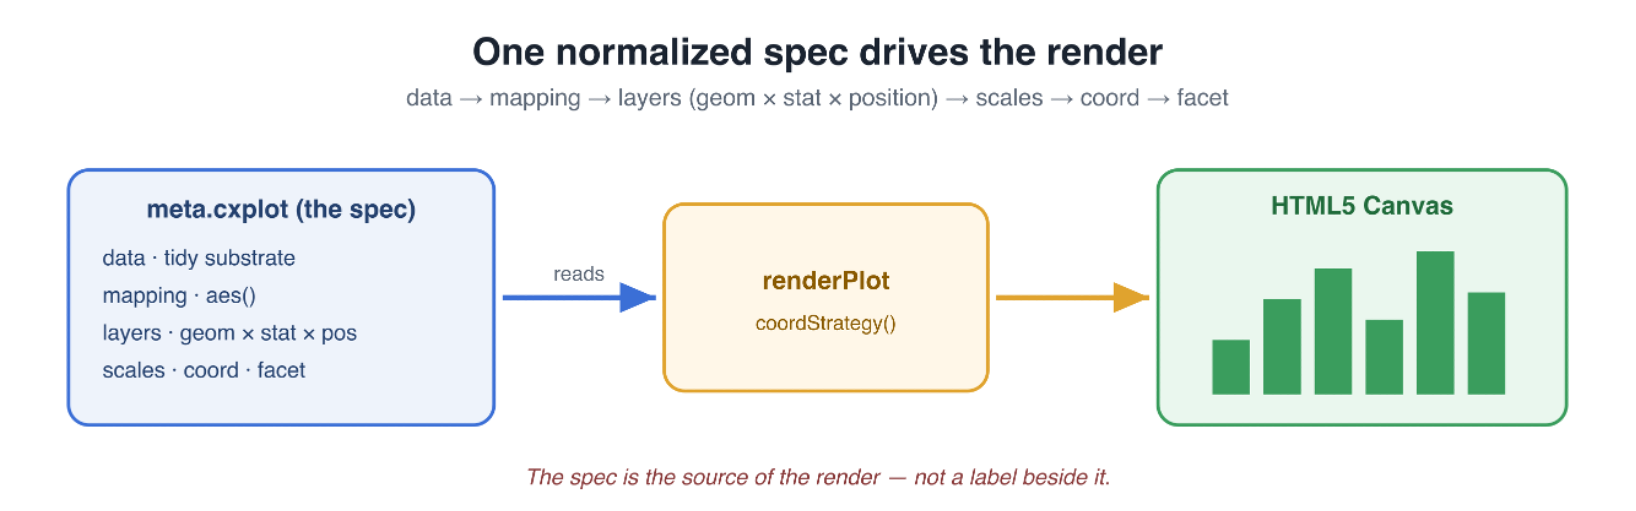
data → aesthetics → layers (geom × stat × position) → scales → coord → facet
Because the vocabulary is shared, the same grammar produces every chart type consistently — for both cartesian and polar families.
The meta.cxplot Spec
The grammar is captured in a single normalized specification, meta.cxplot. It holds the tidy data substrate, the aesthetic mapping, the layers, the scales, the coordinate system and the facet definition. This spec is the source of the render — not a label beside it: the engine function renderPlot() reads the spec and a coordStrategy() resolves it onto the HTML5 canvas.
Because the whole figure is described by a portable JSON spec, it can be saved, shared, diffed, version-controlled, and rebuilt exactly — by a human, by the built-in AI, or by an external agent.
One Engine, One Source of Truth
Every output — in R, Python, Julia, or JavaScript — comes from a single, consistent rendering engine. There is no server dependency: CanvasXpress renders entirely client-side in the browser, so there is nothing to deploy or maintain. Below, one spec renders as a fully interactive chart:
Wide-Matrix Data Model
CanvasXpress stores data as a wide matrix with sample and variable annotations — a natural fit for omics and biomedical tables. Reads are O(1), which keeps large datasets fast, while the grammar layer still exposes tidy, ggplot-style semantics on top. A tidy source is pivoted to the wide render form so you get both: familiar grammar and efficient rendering.
The Figure Carries Its Data
A CanvasXpress figure travels with everything needed to rebuild it. The data and the full spec are embedded inside the exported PNG, SVG or PDF, so sharing one file shares the whole reproducible figure. Drag a CSV, JSON, PNG, PDF or XML file onto a chart and it renders instantly; drop an exported image back in and it re-renders live and fully interactive. Open formats in, open formats out. See File Formats and Initialization.
Four APIs, One Grammar
The same engine and the same grammar sit behind four first-class front doors. Use the tools you already know:
- R —
library(canvasXpress)(CRAN). See the R interface and the ggplot2 interface. - Python —
pip install canvasxpress(PyPI). See the Python interface. - Julia —
Pkg.add("CanvasXpress")(General registry). See the Julia interface. - JavaScript —
<script src="canvasxpress.js">(npm / CDN). See the JavaScript API.
A fluent grammar-of-graphics builder, cxplot(), mirrors ggplot layer composition directly. Humans, the built-in AI copilot, and external agents via the Model Context Protocol server all edit the same meta.cxplot spec.
