CanvasXpress vs. Chart.js
A lightweight library for everyday charts, versus a scientific engine that explores, clusters and reproduces your data. The same dataset, side by side.
Introduction
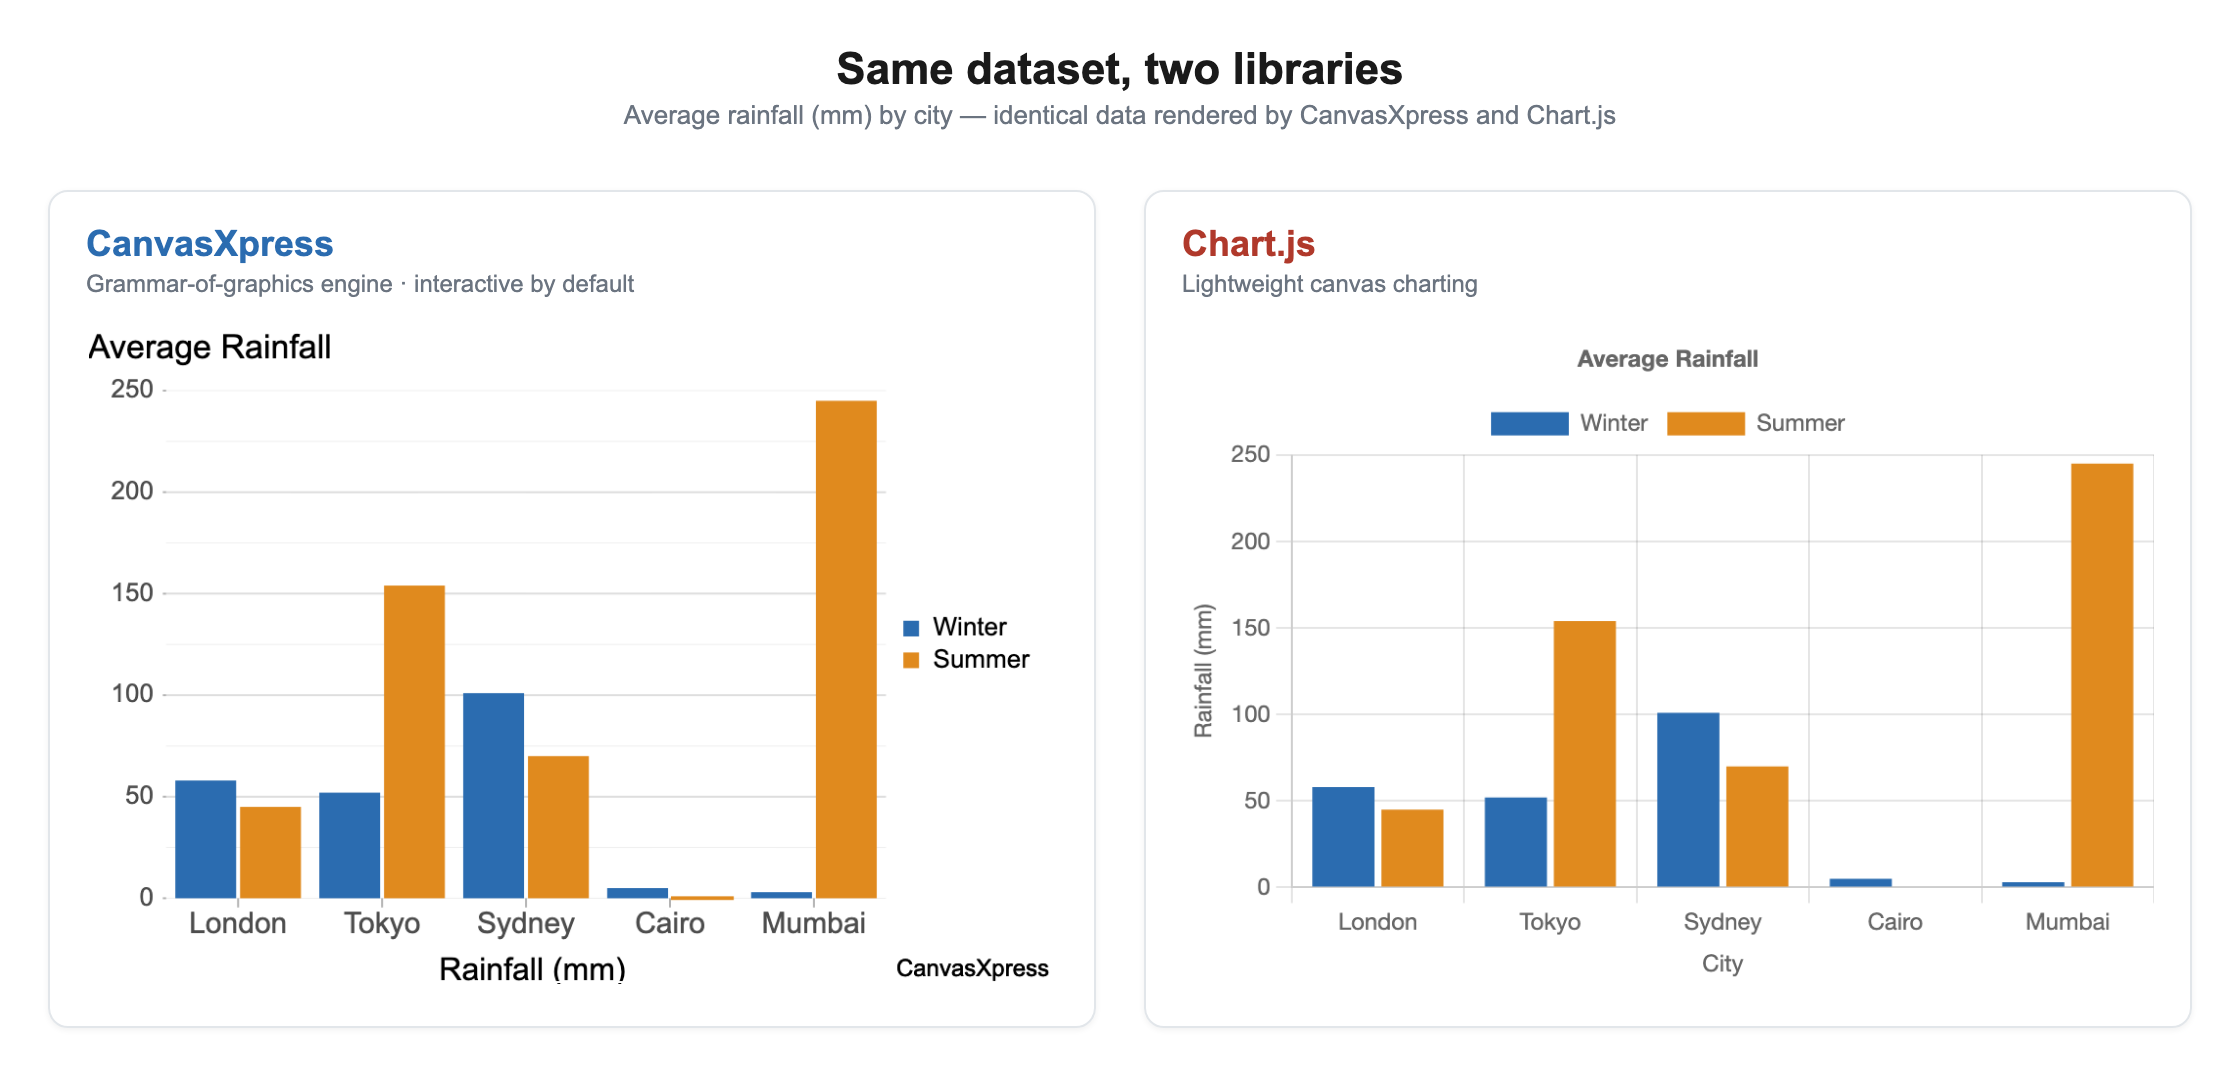
CanvasXpress (source-available) and Chart.js (open-source, MIT) both render to an HTML5 canvas, but they solve different problems. Chart.js is a small, approachable library for adding standard chart types — lines, bars, pies — to a web page. CanvasXpress is a source-available grammar-of-graphics engine for interactive, reproducible scientific visualization: one portable JSON specification drives 40+ chart types, a no-code interactive UI, first-class R and Python APIs, a replayable audit trail, and a built-in AI copilot. Choose Chart.js for a small dependency covering a few common charts; choose CanvasXpress when you need interactivity, scientific chart types, reproducibility, or R and Python workflows. Chart.js is included in the performance benchmarks (it is fast for small charts but not built for high-volume scatter).
What each one is
Chart.js is an open-source (MIT) JavaScript charting library that draws charts on an HTML5 canvas element. It offers around eight core chart types — line, bar, radar, doughnut, pie, polar area, bubble and scatter — configured through a JavaScript options object, and extended through a community plugin ecosystem. It is lightweight, responsive and widely used for straightforward charts in websites, admin panels and business dashboards.
CanvasXpress is a source-available JavaScript library for interactive, reproducible scientific data visualization. A single grammar-of-graphics engine (data → aesthetics → layers → scales → coord → facet) renders 40+ chart types from one portable JSON specification (meta.cxplot). It provides first-class R, Python and JavaScript APIs over the same engine, a no-code interactive UI, built-in clustering and statistics, calculated fields, faceting, cross-chart broadcasting, a replayable audit trail, a built-in AI copilot, and an MCP server so AI agents can build and edit figures.
The same dataset, two libraries
Below is an 8×8 gene-expression matrix rendered by both libraries. The Chart.js panel uses the community chartjs-chart-matrix plugin to approximate a heatmap.
Both draw from identical numbers. The Chart.js grid renders the values in input order; CanvasXpress clustered the rows and columns, drew both dendrograms, and added the Control/Treated strip — natively, with no plugins. A static image cannot show the rest of the difference: what happens after the chart renders.
At a glance
| Dimension | CanvasXpress | Chart.js |
|---|---|---|
| Primary purpose | Interactive, reproducible scientific & analytical visualization | Lightweight standard charts for web pages/dashboards |
| License | Source-available; free anywhere including commercial as long as the attribution mark stays visible; commercial license removes the mark | Open source (MIT) |
| Chart types | 40+ (heatmap, dendrogram, volcano, network, genome, boxplot…) | ~8 core (line, bar, pie, radar, polar, bubble, scatter) + plugins |
| Grammar of graphics | Yes — one composable engine | No — per-type configuration objects |
| Built-in interactivity | Zoom, filter, sort, transform, facet, broadcast — no code | Tooltips, hover, legend toggle; more needs custom code/plugins |
| Built-in analytics | Hierarchical clustering, statistics, calculated fields | None |
| Reproducibility | Every interaction is a replayable grammar operation | None |
| R / Python APIs | Yes — CRAN (canvasXpress) and PyPI (canvasxpress) | No (JavaScript only) |
| AI / agent support | Built-in AI copilot + MCP server (canvasxpress-mcp) | None built-in |
| Accessibility | WCAG 2.1 text alternative generated per chart | Requires manual ARIA/fallback |
| Footprint | Larger (full analytical engine) | Small (minimal dependency) |
The part the image can’t show
Open the CanvasXpress chart and you can zoom, filter, sort, facet, and broadcast a selection across every linked chart on the page — without writing code. Every one of those actions is recorded as a replayable grammar operation, so the analysis is reproducible and auditable. Load the same data in R with library(canvasXpress) or in Python with pip install canvasxpress and you get the same engine and grammar.
That is the CanvasXpress thesis: the chart is not the end product — the exploration is. Chart.js hands you a clean, static picture. CanvasXpress hands you a live analytical instrument that a person, a copilot, or an AI agent can all drive through the same spec.
Built-in vs. plugin
new CanvasXpress("chart", { y: { vars: genes, smps: samples, data: matrix } }, {
  graphType: "Heatmap",
  samplesClustered: true,     // cluster columns -> top dendrogram
  variablesClustered: true,   // cluster rows -> left dendrogram
  distance: "euclidean",
  linkage: "complete",
  smpOverlays: ["Group"]      // the Control/Treated strip
});
Chart.js needs a third-party plugin just to draw the grid, and there is still no clustering, statistics or dendrograms. CanvasXpress ships those as first-class features.
Where each one wins
Reach for Chart.js when you want a small dependency for a handful of common charts, defined once in JavaScript, in a general-purpose web app, and you do not need R or Python integration, reproducibility or scientific chart types.
Reach for CanvasXpress when visualization is central to the work: interactive exploration, scientific and bioinformatics chart types, built-in clustering and statistics, reproducible JSON configs, R and Python bindings, or AI-assisted authoring — things a lightweight charting library is not designed to provide.
Frequently asked questions
Is CanvasXpress a replacement for Chart.js?
Not exactly. Chart.js is a lightweight library for standard charts defined in JavaScript. CanvasXpress is a full grammar-of-graphics engine for interactive, reproducible scientific visualization with no-code exploration and R/Python APIs. CanvasXpress is the stronger fit when interactivity, reproducibility, scientific chart types, or R and Python are required.
Which library has more chart types?
CanvasXpress renders 40+ chart types, including scientific types such as heatmaps with dendrograms, volcano plots, networks and genome browsers. Chart.js provides about eight core chart types, extendable through plugins.
Can I use Chart.js or CanvasXpress with R or Python?
CanvasXpress provides native R (CRAN) and Python (PyPI) packages backed by the same engine and grammar. Chart.js is JavaScript-only and has no official R or Python interface.
Can AI agents generate CanvasXpress or Chart.js charts?
CanvasXpress includes a built-in AI copilot and an MCP server (canvasxpress-mcp) so AI agents can generate and edit chart specifications directly. Chart.js has no built-in AI or agent integration.
Try it
Every example on this site runs live in the browser. Explore the examples gallery or read the full library comparisons.
