CanvasXpress vs. D3
A high-level, config-driven charting library versus a low-level toolkit where you draw everything. The same dataset, side by side.
Introduction
CanvasXpress and D3.js solve different problems. CanvasXpress is a high-level, JSON-configuration charting library: you pass data and a config object, and it renders one of 40+ built-in, interactive chart types — heatmaps, scatter, genome browsers, network graphs — on an HTML5 canvas. D3.js is a low-level toolkit for binding data to the DOM and building fully custom visualizations from primitives (scales, axes, SVG shapes); it ships no chart types at all. Choose CanvasXpress for production-ready, interactive scientific and statistical charts with minimal code; choose D3 when you need a bespoke, one-of-a-kind visualization and are willing to write the rendering logic yourself. Because D3 ships no chart to call, it is deliberately excluded from the performance benchmarks (which compare charting libraries — Plotly, ECharts, deck.gl, Chart.js); timing D3 would measure a hand-written scatter, not the library.
What each one is
CanvasXpress is a source-available JavaScript library that renders 40+ interactive chart types from a single JSON configuration, on an HTML5 canvas, with built-in data tables, filtering, and reproducible-research state. It is source-available and free to use anywhere — including commercial products — as long as the attribution mark stays visible; a commercial license removes the mark (see the license). It was originally built for biomedical and scientific data and ships matching R and Python packages that produce the same charts.
D3.js (Data-Driven Documents) is an open-source library that binds data to DOM elements and provides low-level building blocks — scales, axes, transitions, geographic projections — for constructing custom, mostly SVG-based visualizations. It does not provide pre-made chart types.
The same dataset, two libraries
Identical data — average monthly rainfall for London, Tokyo, and Cairo — rendered as a grouped bar chart by each library.
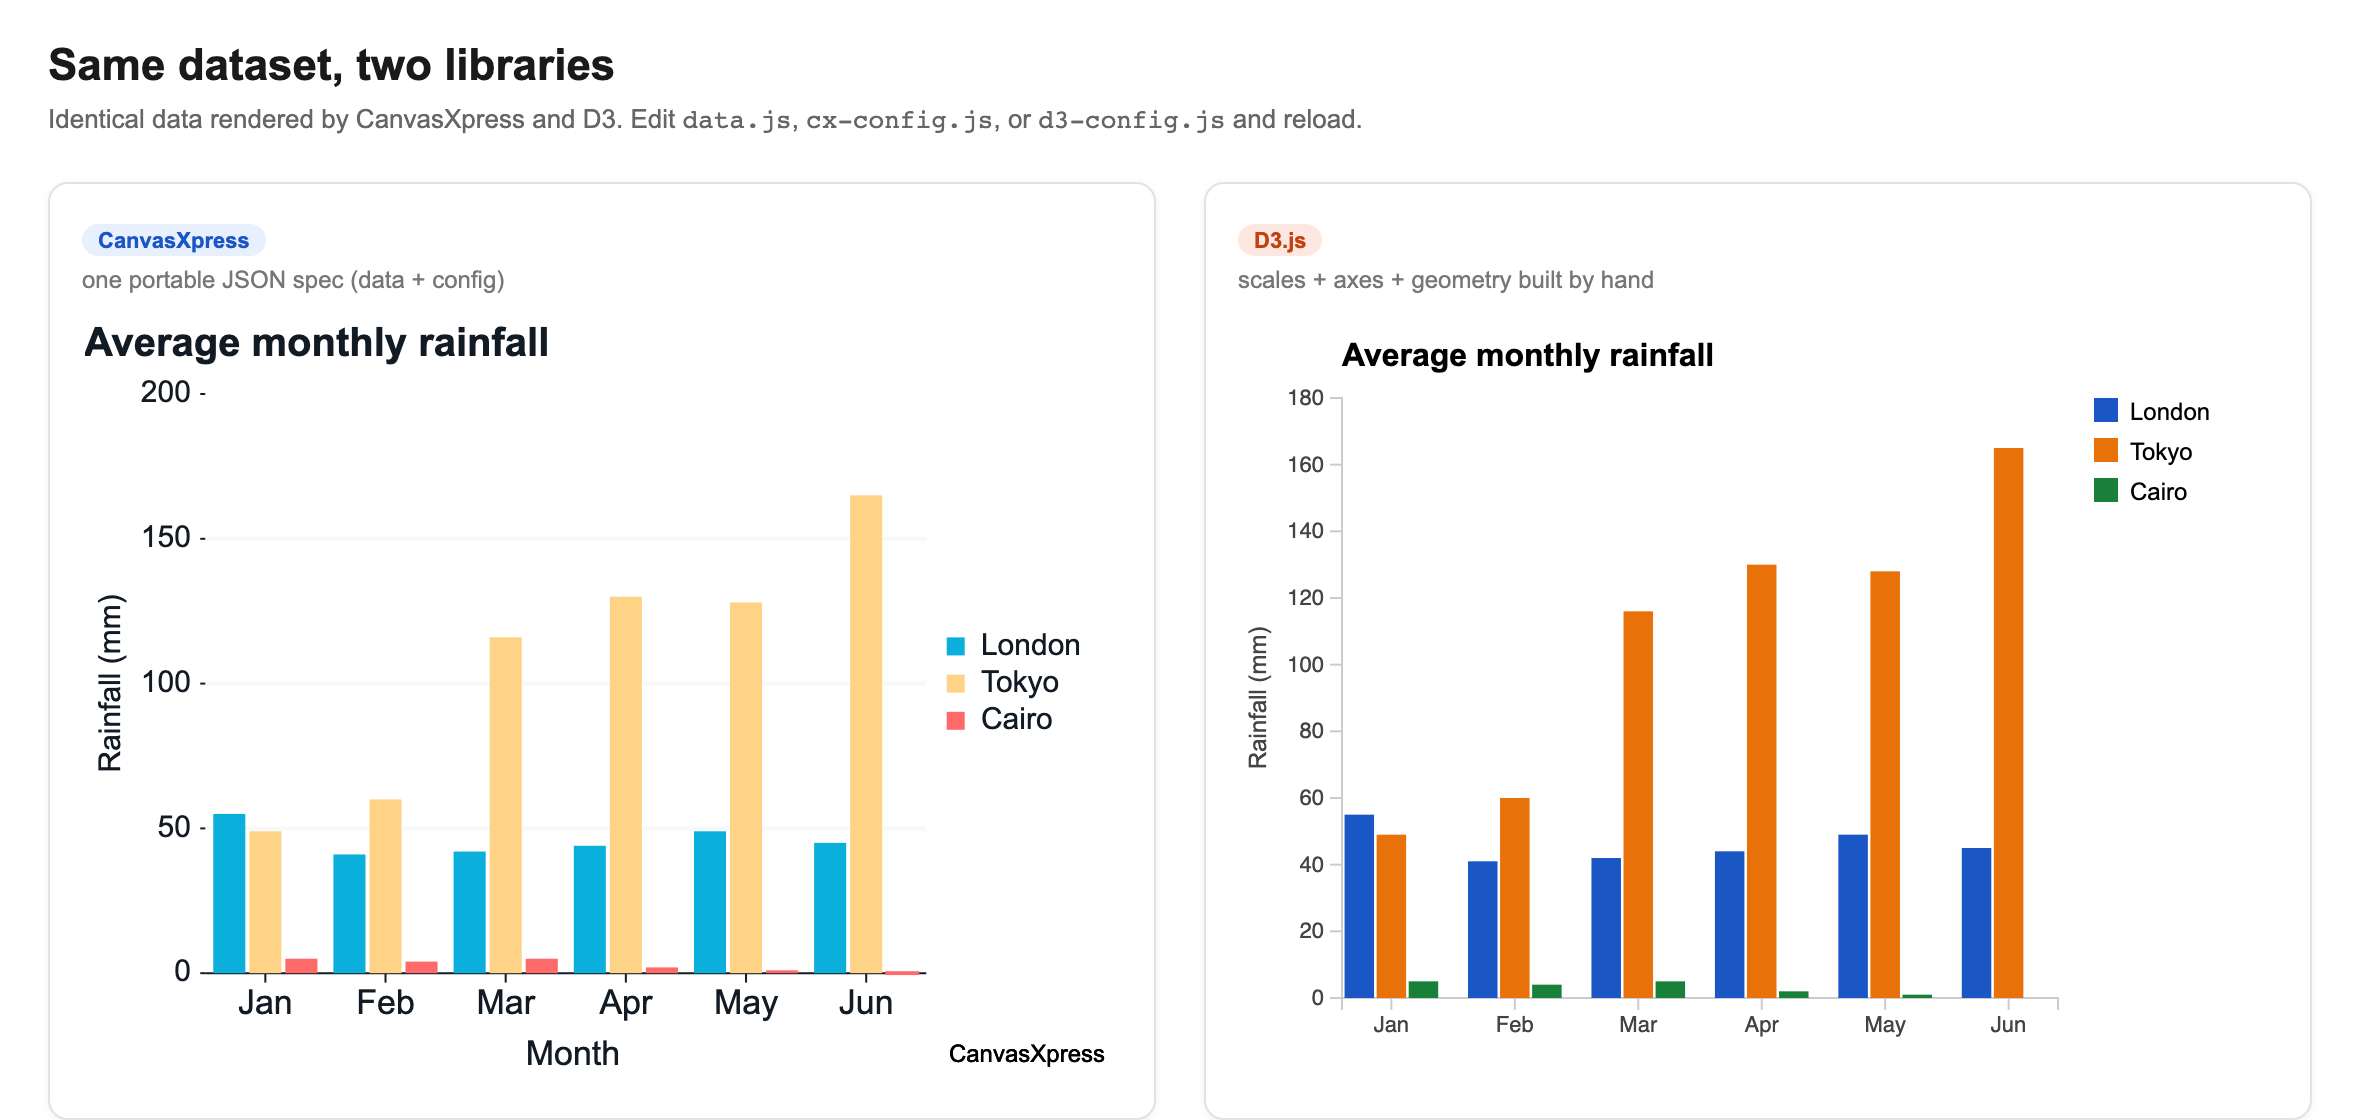
Both panels are the same numbers. The CanvasXpress chart came from a single JSON object — roughly six lines. The D3 chart required hand-building scales, axes, a grouped-bar layout, and a legend, closer to thirty. Both are the real libraries drawing the same data.
At a glance
| Dimension | CanvasXpress | D3.js |
|---|---|---|
| Abstraction level | High-level (config-driven) | Low-level (primitives) |
| Built-in chart types | 40+ ready to use | 0 (you build them) |
| Primary API | JSON config object | Data-binding + selections |
| Rendering | HTML5 Canvas | SVG (also Canvas/HTML) |
| Lines of code for a chart | ~5–10 | ~50–200+ |
| Interactivity (zoom, hover, filter) | Built-in | Hand-coded |
| Statistical / scientific charts | Native | Manual |
| Reproducibility / state export | Built-in | None |
| Large-dataset performance | Canvas-optimized, decimation | Depends on your code |
| Best for | Fast, standardized, interactive charts | Fully bespoke visualizations |
Where each one wins
Reach for CanvasXpress for production-ready interactive charts fast; scientific, statistical, or bioinformatics data; built-in interactivity, data tables, filtering, and reproducibility; or the same charts from JavaScript, R, or Python.
Reach for D3 when you need a completely custom, novel visualization with no chart-type equivalent, pixel-level control over every mark and transition, or you are building your own reusable visualization framework and have the engineering time to maintain it.
Common questions
Is CanvasXpress easier than D3? Yes, for standard chart types. CanvasXpress renders a complete interactive chart from a data matrix and a config object in a few lines, while D3 requires you to manually build scales, axes, marks, and interaction handlers.
Can D3 do everything CanvasXpress does? In principle yes, but not out of the box. D3 is a toolkit, so any CanvasXpress chart could be rebuilt in D3 — at the cost of writing and maintaining the rendering, interactivity, and data-handling code that CanvasXpress provides natively.
Which is faster for large datasets? CanvasXpress uses HTML5 Canvas with built-in decimation and is generally more performant for large scatter and heatmap data than typical SVG-based D3 charts. D3 performance depends on the implementation you choose.
Does CanvasXpress support R and Python? Yes. CanvasXpress provides R and Python packages that generate the same interactive charts from those environments.
Try it
Every example on this site runs live in the browser. Explore the examples gallery or read the full library comparisons.
