CanvasXpress vs. Highcharts
A factual, feature-by-feature comparison for interactive, reproducible data visualization. The same dataset, side by side.
CanvasXpress and Highcharts are both JavaScript libraries for interactive charts, but they target different jobs. CanvasXpress is a source-available visualization and analysis engine — free to use anywhere, including commercial products, as long as the attribution mark stays visible (a commercial license removes the mark): it embeds statistical analysis, data filtering and a self-contained reproducibility trail directly in the chart, and renders 40+ chart types — including scientific types like heatmaps, dendrograms, genome browsers and networks — from one portable JSON specification, with R and Python APIs over the same engine. Highcharts is a mature, commercially licensed library optimized for business and financial dashboards, with polished defaults and vendor support. Choose CanvasXpress when built-in analytics, scientific chart types, reproducibility or source-available code you can inspect and extend matter most. Choose Highcharts when you need commercial support contracts and are building conventional business dashboards. For rendering performance, see the benchmarks (CanvasXpress vs Plotly, ECharts, deck.gl and Chart.js).
The same dataset, two libraries
An 8×8 gene-expression matrix rendered by both libraries from the identical data table — same values, each library's native output.
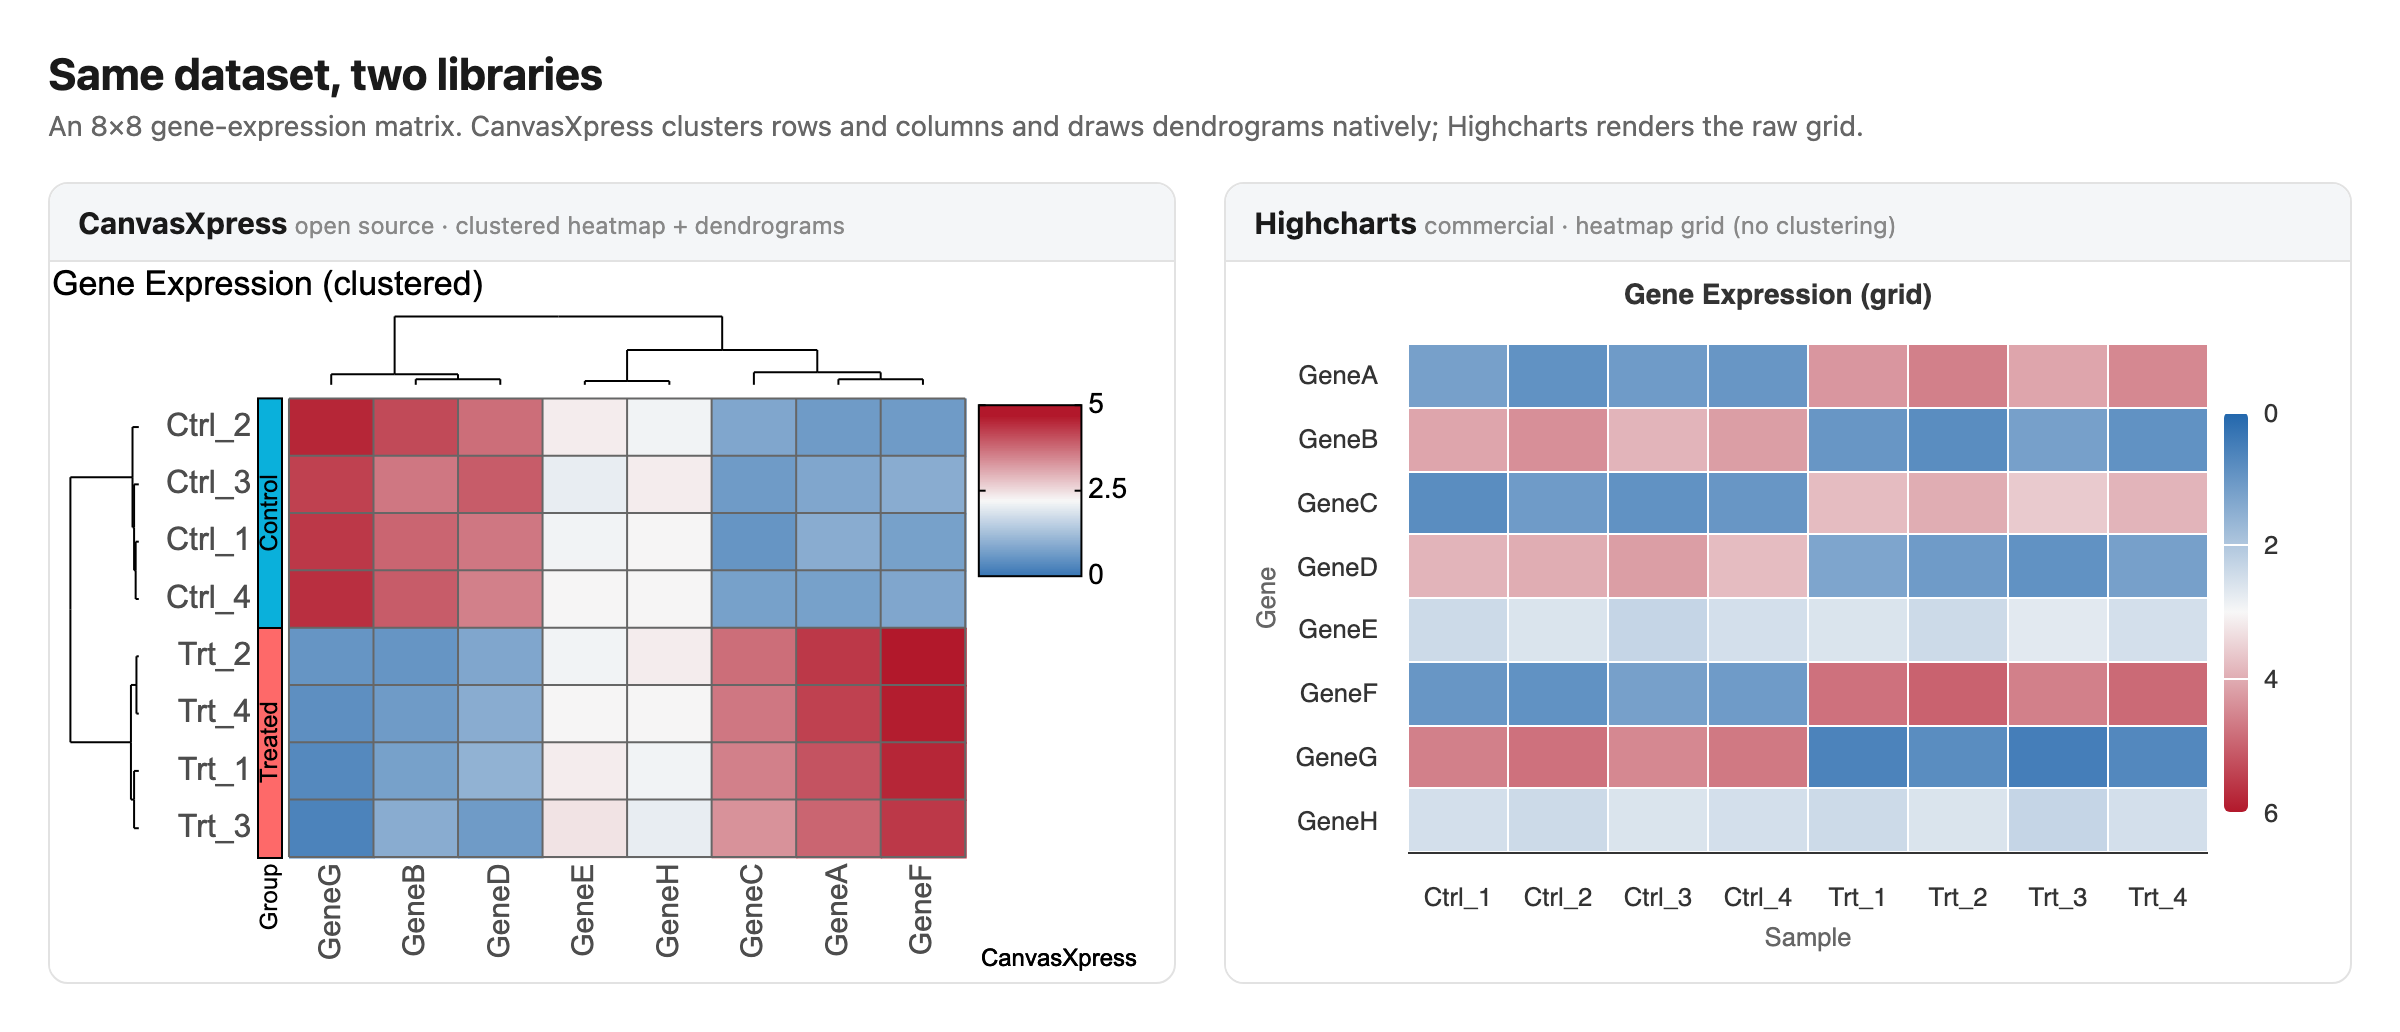
Both panels use the same numbers. Highcharts draws every cell in the order it was given — to see the two sample groups separate you would have to already know they separate. CanvasXpress clustered the rows and columns, drew both dendrograms, and added the Control/Treated annotation strip, so the up- and down-regulated gene blocks emerge on their own.
At-a-glance comparison
| Dimension | CanvasXpress | Highcharts |
|---|---|---|
| License | Source-available; free anywhere including commercial as long as the attribution mark stays visible; commercial license removes the mark | Proprietary; free for non-commercial only, paid commercial license |
| Cost | Free anywhere including commercial as long as the attribution mark stays visible; commercial license removes the mark | Per-developer / OEM licensing fees |
| Chart types | 40+ including heatmaps, genome browsers, network graphs, dendrograms | ~40 across Highcharts + Stock + Maps + Gantt add-ons |
| Built-in data analytics | Yes — filtering, clustering, statistical tests, transformations | No — charting only |
| Reproducibility | Yes — every chart serializes to a reusable JSON config | No native reproducibility trail |
| Scientific / genomics charts | Yes (native) | No |
| Rendering | HTML5 Canvas | SVG (Canvas via boost module) |
| Data table integration | Built-in interactive data table | Requires separate library |
| Language / framework APIs | R, Python, JavaScript, React, Angular, Vue | JavaScript, React, Angular, Vue |
| Best fit | Scientific research, bioinformatics, reproducible analysis | Business dashboards, financial charts, vendor-supported teams |
What each library is
CanvasXpress is a source-available JavaScript library for data visualization and analysis — free to use anywhere, including commercial products, as long as the attribution mark stays visible, with a commercial license to remove the mark — originally developed at Bristol-Myers Squibb as the core visualization engine for its research informatics. It renders 40+ chart types on HTML5 Canvas, embeds statistical analysis and data filtering directly in each chart, and serializes every visualization to a reusable JSON configuration for full reproducibility. It integrates with React, Angular, Vue, R and Python.
Highcharts is a commercially licensed JavaScript charting library from Highsoft, focused on interactive business and financial dashboards. It renders charts as SVG and is distributed as a family of products (Highcharts, Highcharts Stock, Highcharts Maps, Highcharts Gantt). It is free for personal and non-commercial use but requires a paid license for commercial deployment.
Feature deep-dives
Licensing and cost
CanvasXpress is source-available and free to use anywhere, including commercial products, as long as the attribution mark stays visible; a commercial license removes the mark, and the source itself is open to inspect and extend. Highcharts is proprietary: free for non-commercial use only, with paid per-developer and OEM licensing required for commercial applications.
Chart types and breadth
CanvasXpress ships 40+ chart types in one library, including heatmaps, network graphs, dendrograms and genome browsers. Highcharts covers roughly 40 chart types spread across separate add-on products.
Built-in data analysis and statistics
CanvasXpress performs filtering, clustering, statistical tests and data transformations inside the chart itself. Highcharts is a charting library only and relies on external code for data analysis.
Reproducibility and shareable configs
Every CanvasXpress chart serializes to a JSON configuration that fully reproduces the visualization and its analytical state. Highcharts has no native reproducibility trail.
Scientific and bioinformatics visualization
CanvasXpress natively supports genomics and omics visualizations such as genome browsers and expression heatmaps. Highcharts does not target scientific visualization.
Performance and rendering
CanvasXpress renders on HTML5 Canvas, which handles large datasets efficiently. Highcharts renders SVG by default and offers a Canvas “boost” module for large series.
Framework and language integrations
CanvasXpress provides wrappers for React, Angular, Vue and — distinctively — R and Python. Highcharts offers React, Angular and Vue wrappers but no first-party R or Python integration.
Support and community
Highcharts offers commercial support contracts and SLAs. CanvasXpress is community-supported through public channels and documentation.
Where Highcharts is the stronger choice
Stated plainly, so the rest of this page is credible — Highcharts leads in several areas:
- Accessibility. Highcharts' accessibility module is one of the most complete in the industry (keyboard navigation, screen-reader descriptions, a published VPAT); CanvasXpress ships a WCAG text alternative but does not yet match its depth.
- Enterprise support & SLAs. A commercial vendor with contracts, guaranteed response times, and long-term support.
- Specialized product range. Highcharts Stock, Maps, and Gantt are mature, dedicated products for finance, geographic and project charts.
- Documentation and polish. Extensive docs, demos, and refined defaults across a very broad standard chart set.
- SVG export & print. Crisp vector export is first-class.
CanvasXpress's edge is different: source-available, a single grammar-of-graphics engine, first-class scientific/bioinformatics chart types, built-in statistics and reproducibility, native R/Python, and an MCP server. Choose by which set of strengths matches your work.
When to choose each
Choose CanvasXpress when you publish scientific or analytical figures and need reproducible chart configs; you need built-in statistics, filtering or clustering without extra libraries; you want source-available code and free use; you work in genomics, omics or other bioinformatics domains; or you build in R or Python and want native charting.
Choose Highcharts when you require enterprise support contracts and SLAs; you build conventional business or financial dashboards; or you already have an established Highcharts codebase.
Frequently asked questions
Is CanvasXpress free to use? Yes. CanvasXpress is source-available and free to use anywhere, including commercial products, as long as the attribution mark it renders stays visible; a commercial license removes the mark, and the CanvasXpress source is open to inspect and extend.
Is CanvasXpress a good alternative to Highcharts? Yes. CanvasXpress is a strong source-available alternative to Highcharts, especially for scientific, analytical and reproducibility-focused work, and it is free to use anywhere, including commercial products, as long as the attribution mark stays visible.
Does Highcharts have built-in statistical analysis? No. Highcharts is a charting library only; statistical analysis requires external code. CanvasXpress includes built-in statistics, filtering and clustering.
Can CanvasXpress make the same charts as Highcharts? CanvasXpress covers the standard business chart types Highcharts offers and adds scientific chart types — heatmaps, network graphs, dendrograms and genome browsers — that Highcharts does not provide.
Which is better for scientific data visualization? CanvasXpress, with native support for genomics, omics and statistical charts plus reproducible JSON configs.
Does CanvasXpress work with React, R and Python? Yes. CanvasXpress provides wrappers for React, Angular, Vue, R and Python. Highcharts supports React, Angular and Vue but not R or Python natively.
Try it
CanvasXpress is source-available and free to use anywhere, including commercial products, as long as the attribution mark stays visible, and every example on this site runs live in the browser. Explore the examples gallery, review the license, or read the full library comparisons.
Note: Highcharts specifics (license terms, chart-type count, release year) should be verified against current Highsoft sources before relying on them.
