By Isaac Neuhaus · September 28, 2026
Disclosure: I am the author and lead maintainer of CanvasXpress. I've tried to write a fair comparison, including the many places where Tableau is the better choice. If anything here is inaccurate or out of date, please say so in the comments and I'll fix it.
Tableau is the benchmark for self-service visual analytics. For many people, "make a dashboard" simply means "open Tableau." So when someone asks how CanvasXpress compares, the honest answer has two parts:
- The CanvasXpress engine is a different kind of product from Tableau: a library you embed, not a BI platform.
- CanvasXpress-Dashboards, the self-hosted dashboard application built on that engine, does compete with Tableau for some jobs. It is much younger and narrower, but it is real.
What each one is
Tableau (owned by Salesforce) is an enterprise business-intelligence platform. Analysts connect to data in Tableau Desktop or in the browser, drag fields onto shelves to build views, combine views into dashboards, and publish them to Tableau Cloud or Tableau Server, where permissions, scheduling, data sources and sharing are managed centrally. Around that core are Tableau Prep for data preparation, the Hyper in-memory engine, a very large set of native connectors, AI features, and one of the largest and most active user communities in analytics.
CanvasXpress is a visualization and analysis engine: a source-available JavaScript library with R, Python and React interfaces that share one engine. It renders 40+ chart types from a single portable JSON specification, built on a grammar of graphics. You embed it inside your own web app, notebook, Shiny/Dash/Streamlit app or report. Every chart has a no-code interactive UI: filtering, faceting, transforms, calculated fields, binning, aggregation, linked selections across charts, and Tableau-style shelves for mapping fields to marks. It was born in pharmaceutical bioinformatics, and scientific charts are its home ground.
CanvasXpress-Dashboards (MIT-licensed) adds the platform layer. It has two parts:
- An embeddable renderer that turns one JSON spec into a grid of linked charts.
- A complete self-hosted application (one
docker compose up). It has sign-in, a no-code drag-and-drop Builder, an AI dashboard builder, saved dashboards, dataset uploads and share links.
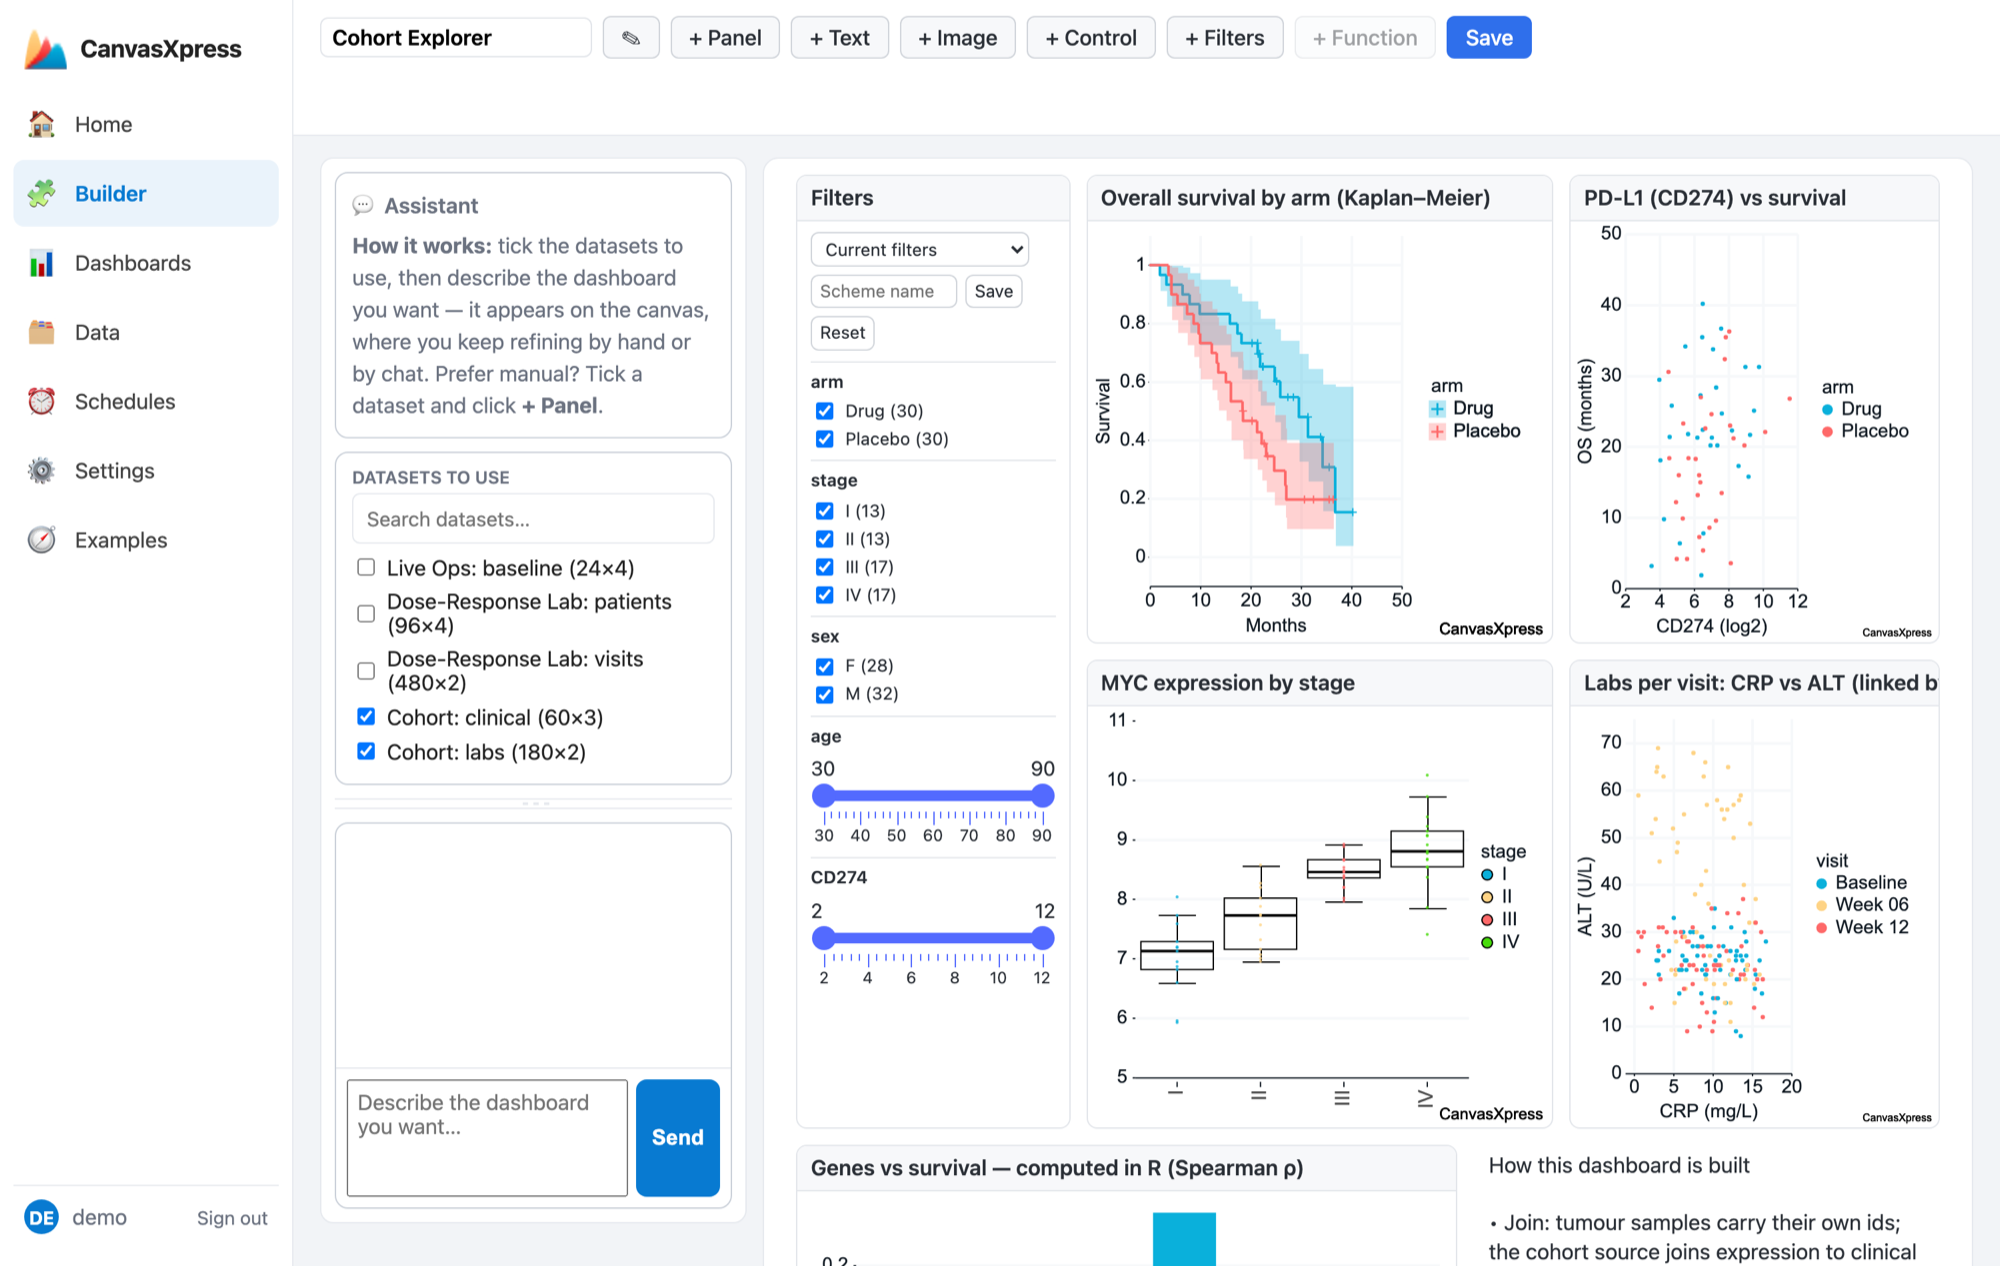
It includes the pieces a Tableau user would look for:
- Data modeling. Joins (inner, left, right, outer) that blend sources, pushed down to the database when possible. Relationships link sources without blending them, so selecting in one chart marks related rows in charts on other sources.
- Interactivity. Filter panels, saved filter states, and parameter controls that re-query the database.
- Governance. Roles, row- and column-level security, OpenID Connect single sign-on (Okta, Entra, Google and others), a tamper-evident audit log, dashboard-to-dataset lineage, and immutable version history.
- Scheduling. Data refreshes, alerts evaluated separately for each recipient's permitted data, and emailed dashboard subscriptions.
- Extensibility. R and Python data functions run on the server and feed charts like any other data source.
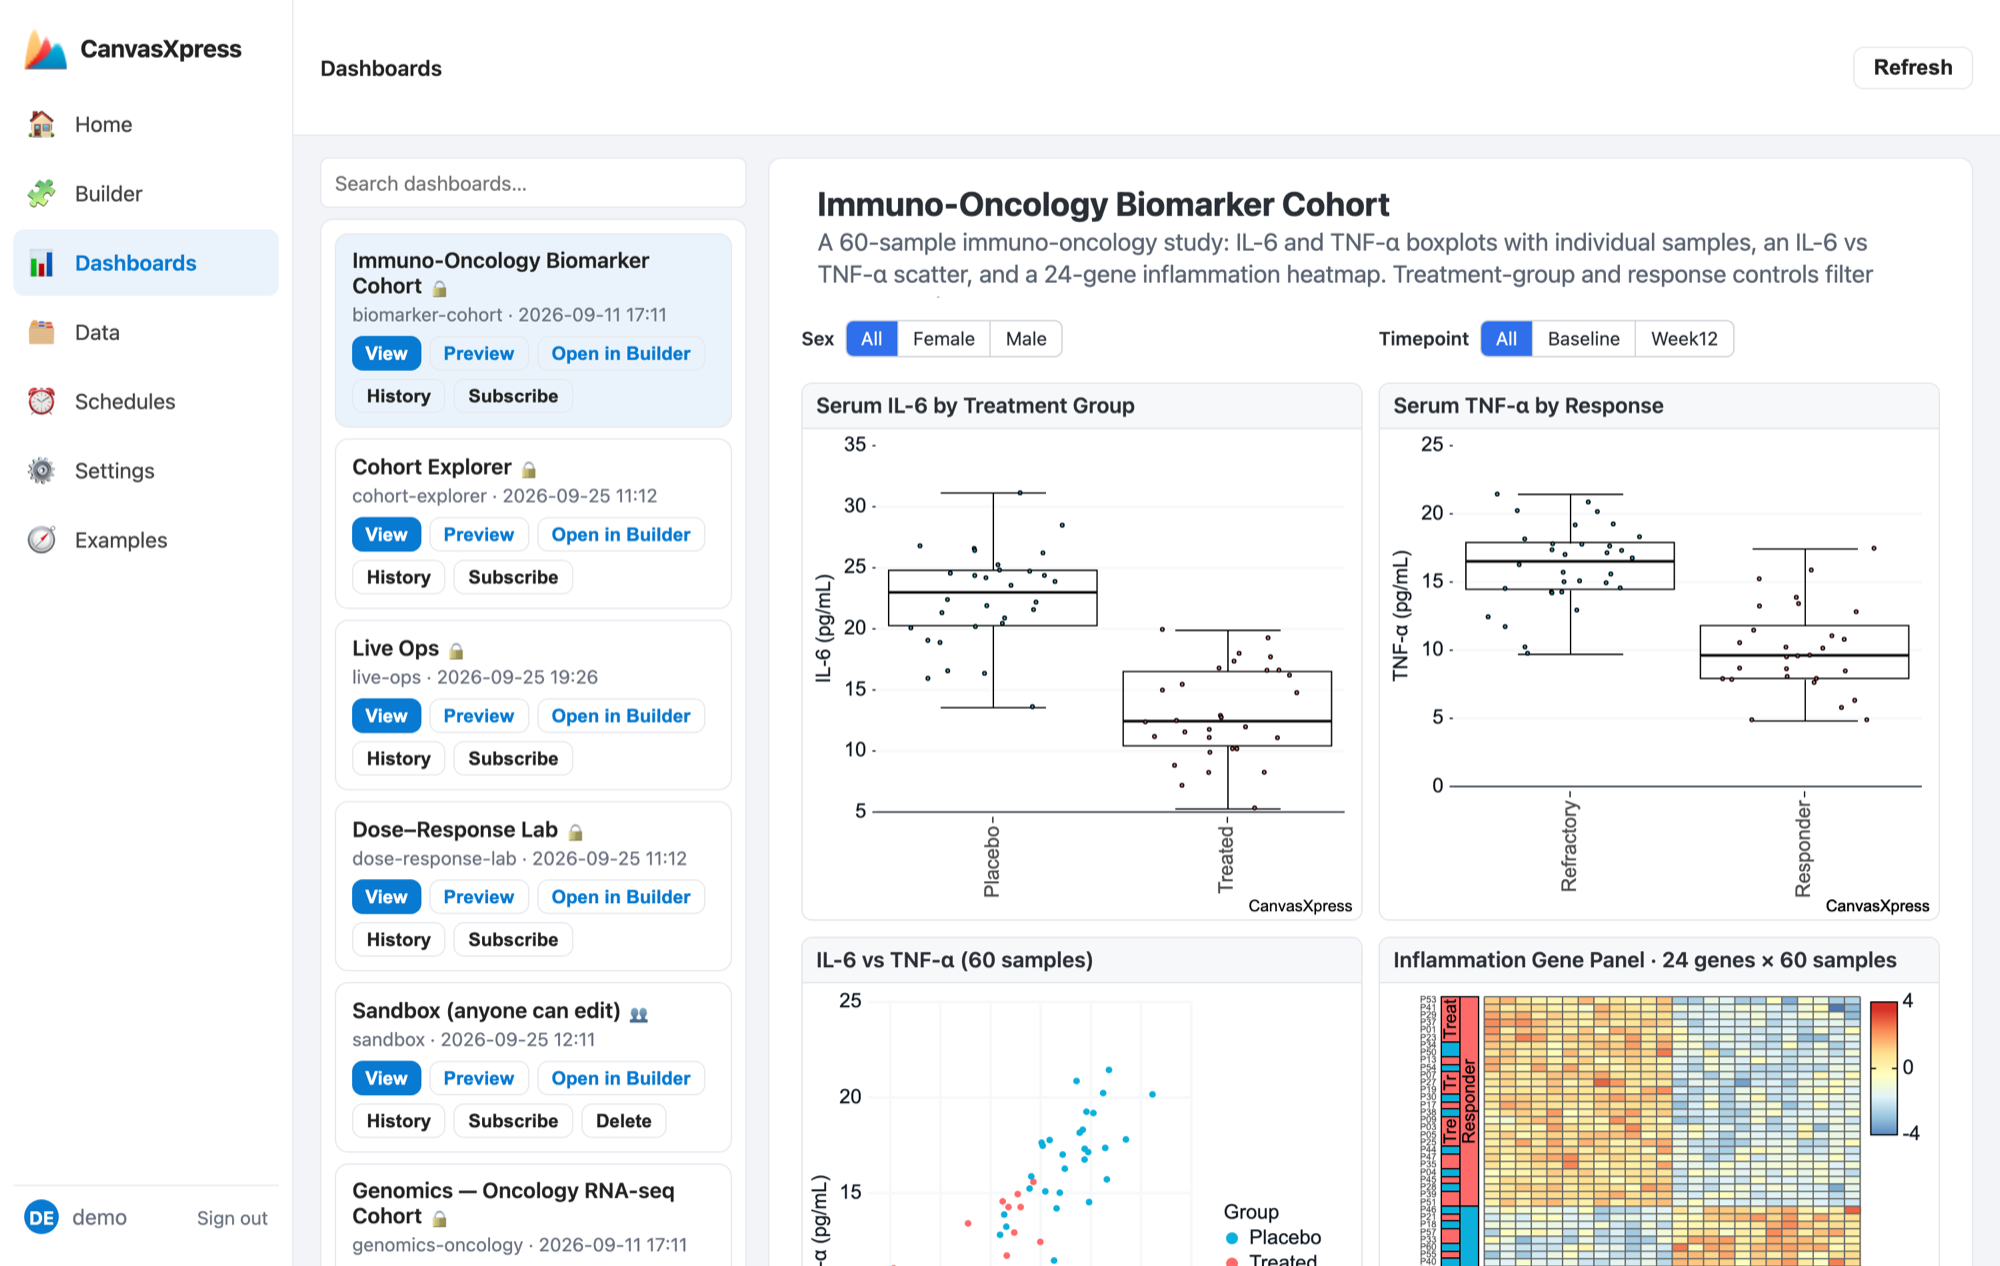
In short, Tableau is a mature BI platform for analysts. CanvasXpress is an engine you can embed anywhere, and CanvasXpress-Dashboards is a young, self-hosted platform built on it.
Where Tableau is stronger
1. Self-service analytics for non-programmers. This is Tableau's defining strength and it is excellent. CanvasXpress-Dashboards has a no-code Builder, and a non-programmer can assemble linked dashboards with it. But Tableau's authoring experience is deeper and far more refined. It offers "Show Me" chart recommendations, fluid drag-and-drop analysis, polished formatting controls, Tableau Prep for data cleaning, and years of design work aimed at exactly this user.
2. Data connectivity and performance on big data. Tableau ships a very broad range of native connectors, live-query and extract modes, and the Hyper in-memory engine. CanvasXpress's connectors support a smaller set (SQL via SQLAlchemy, DuckDB/Parquet, Google Sheets, Google Analytics, Salesforce, ServiceNow and a few others). It pushes aggregation, filters and joins down to the database. That is a solid live-query story, but not remotely the same breadth.
3. Calculation language and analytics depth for business data. Tableau's calculated fields, table calculations, level-of-detail (LOD) expressions, parameters and forecasting are mature and well documented, and you can extend them with Python and R via TabPy. CanvasXpress has calculated fields, binning, aggregation, clustering, regression fits, LOESS and time-series forecasting, plus server-side R and Python data functions in dashboards. It has nothing equivalent to LOD expressions or Tableau's full calculation model.
4. Enterprise governance at proven scale. Both have roles, row-level security, SSO, scheduling and lineage on paper. The difference is depth and track record:
- Tableau adds data-source certification, column-level lineage across an enterprise catalog (Tableau Catalog), rich content management and admin tooling.
- It has run in the world's largest deployments for years.
- CanvasXpress-Dashboards was first released in mid-2026, is at version 0.10, and tracks lineage at the dashboard-to-dataset level only.
5. Community, talent and ecosystem. Tableau Public, a huge global user community, countless tutorials, certifications, consultants and a large hiring pool. If you need to staff a team or find an answer quickly, Tableau wins by orders of magnitude. CanvasXpress is maintainer-led, with a small group of committers and a published succession policy. For many organizations, that difference in vendor backing is decisive on its own.
6. Business-dashboard polish. For KPI boards, sales dashboards and executive reporting, Tableau's defaults, formatting controls and dashboard layout tools are hard to beat.
Where CanvasXpress is stronger
1. Embedding in your own application. CanvasXpress runs entirely in the browser and drops into any web page, React app, Jupyter/Colab/marimo notebook, VS Code notebook, Quarto document, Shiny app, or Dash/Streamlit app in a few lines. A full linked dashboard renders the same way, from a spec, with no server and no per-viewer license. Embedding Tableau means the Embedding API or an iframe pointing at a licensed Tableau Server or Cloud site, with viewer licensing to match. If the charts are part of your product and serve many users, this is usually the biggest single factor.
2. Self-hosted, with no per-seat pricing. If you want a BI-style server (sign-in, sharing, security, scheduling) but not a per-user subscription, the whole CanvasXpress-Dashboards application runs on your own infrastructure. You swap SQLite for Postgres, and local files for S3 or Google Drive, through environment variables, without forking the code. Tableau Server can be self-managed too, but it is licensed per user or per core.
3. Code-first reproducibility, down to the dashboard. A CanvasXpress chart and a CanvasXpress dashboard are both plain JSON documents. They are versionable in Git, validated against a published schema, and generated from R or Python. A CLI produces structural diffs that are readable in code review ("panel X changed chart type"), not text noise. Every interaction on a chart is recorded as a replayable operation, and every dashboard save creates an immutable, hashed version, which can carry electronic signatures aimed at 21 CFR Part 11. Tableau workbooks (.twb/.twbx) are XML-based and can be versioned, but they are built for the GUI and are not practical to author or review as code.
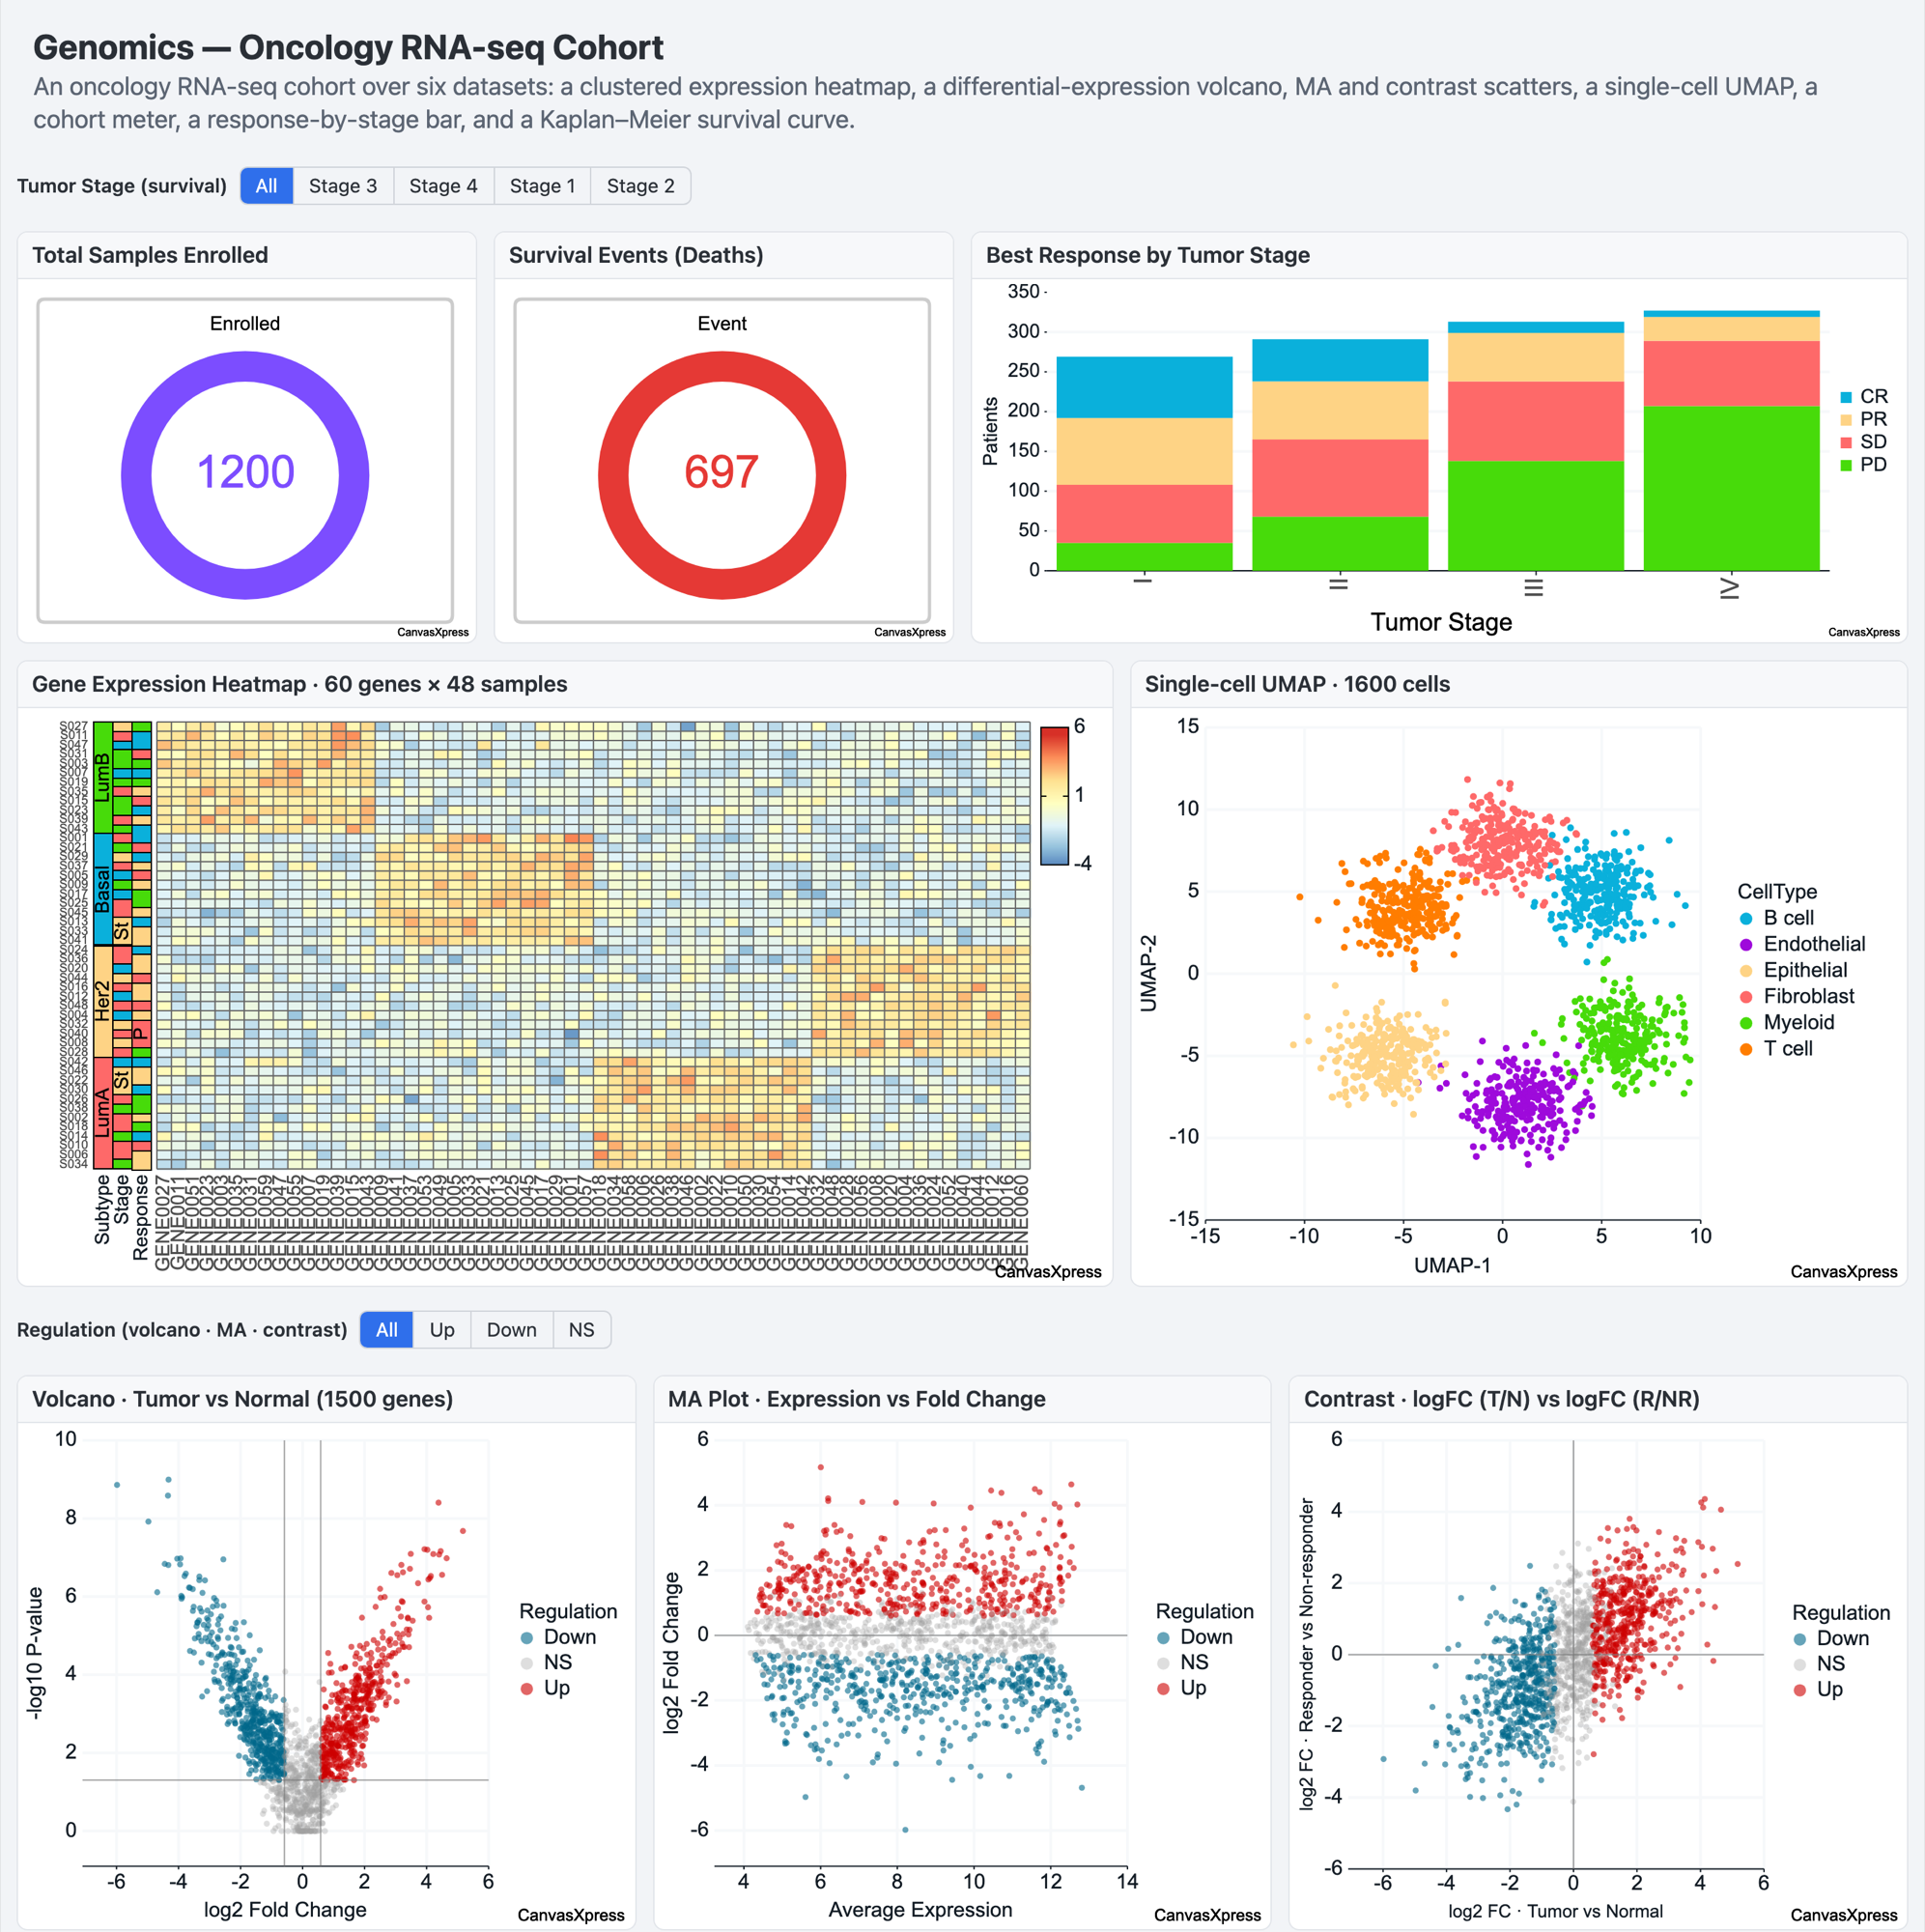
4. Scientific and bioinformatics charts. Clustered heatmaps with dendrograms, oncoprints, genome browser tracks, circular plots, networks, volcano plots, Kaplan-Meier curves and dose-response curves are native chart types, and they work in any dashboard panel. In Tableau, many of these need workarounds, extensions or significant custom effort, and some are not practical at all.
5. R and Python workflows. CanvasXpress is on CRAN, Bioconductor and PyPI, and it can convert many ggplot2 plots into interactive figures. A data scientist can make a chart interactive without leaving their notebook or script. In dashboards, the same person can drop an R or Python function in as a data source.
6. Cost structure. The CanvasXpress engine is free to use anywhere, including commercially, as long as its small attribution mark stays visible. A paid commercial license removes it. The dashboards package is MIT, the R package is GPL-3 and the Python package is MIT. Tableau is a per-user subscription with different prices for creators, explorers and viewers, and embedded or external-facing use has its own licensing considerations. Check current Tableau pricing for your case; for a small team or a widely distributed app, the difference can be large.
7. AI agents and developer tooling. CanvasXpress has a built-in AI copilot, an AI dashboard builder, and an MCP server, so AI agents (Claude, Copilot-style assistants, custom agents) can create and edit figures from natural language. It can also run against a fully local model with outbound AI calls turned off. It ships strict TypeScript definitions and an ESM package. Tableau's AI features are strong but live inside the Tableau/Salesforce platform.
Things to be clear-eyed about
- "Source-available" is not "open source." The dashboards package is MIT, but it runs on the CanvasXpress JavaScript library, which uses a community attribution license rather than an OSI-approved one. The attribution requirement is a real condition. Check it against your organization's dependency policy.
- Young versus proven. CanvasXpress-Dashboards has the feature list of a real BI server, but it is at version 0.10. Pilot it before a large rollout.
- Browser rendering has limits. CanvasXpress performs well for a charting library (its public, reproducible benchmarks include the cases where other libraries win), and database pushdown keeps large tables on the server. But it does not replace a warehouse plus an in-memory BI engine for very large interactive exploration.
- Tableau is free in some contexts too. Tableau Public is free for public data and is a great learning and portfolio tool. It just isn't meant for private or embedded use.
So which should you choose?
Choose Tableau when:
- Business analysts need a deep, polished self-service tool to explore governed enterprise data.
- You need broad data connectivity, extracts, and an in-memory engine for large datasets.
- You need proven enterprise administration, certification and catalog-level lineage across many teams.
- Hiring, training and community support matter more than embedding or code-driven workflows.
Choose CanvasXpress (and CanvasXpress-Dashboards) when:
- Charts or dashboards need to live inside your own application, portal, notebook or report, for many users, without per-viewer licensing.
- You want a self-hosted dashboard server on your own infrastructure, with SSO, row-level security and scheduling, but no per-seat subscription.
- Reproducibility and code review matter: charts and dashboards as JSON in Git, with interaction replay and version history.
- Your team works in R, Python or JavaScript, or needs scientific visualizations such as heatmaps, oncoprints, genome tracks and networks.
- You're comfortable adopting, and piloting, a young platform.
Or use both. Plenty of organizations will run Tableau for business reporting and use CanvasXpress for product features, research pipelines, scientific dashboards and figures. That isn't a compromise; each tool is doing the job it does best.
Try CanvasXpress: canvasxpress.org. The site has a side-by-side comparison with Tableau and Spotfire, an accessibility conformance report, and reproducible benchmarks. CanvasXpress-Dashboards is npm install canvasxpress-dashboards, or docker compose up for the full app. Corrections are welcome in the comments.
Also in this series: CanvasXpress vs. Spotfire · CanvasXpress vs. Plotly Dash.
