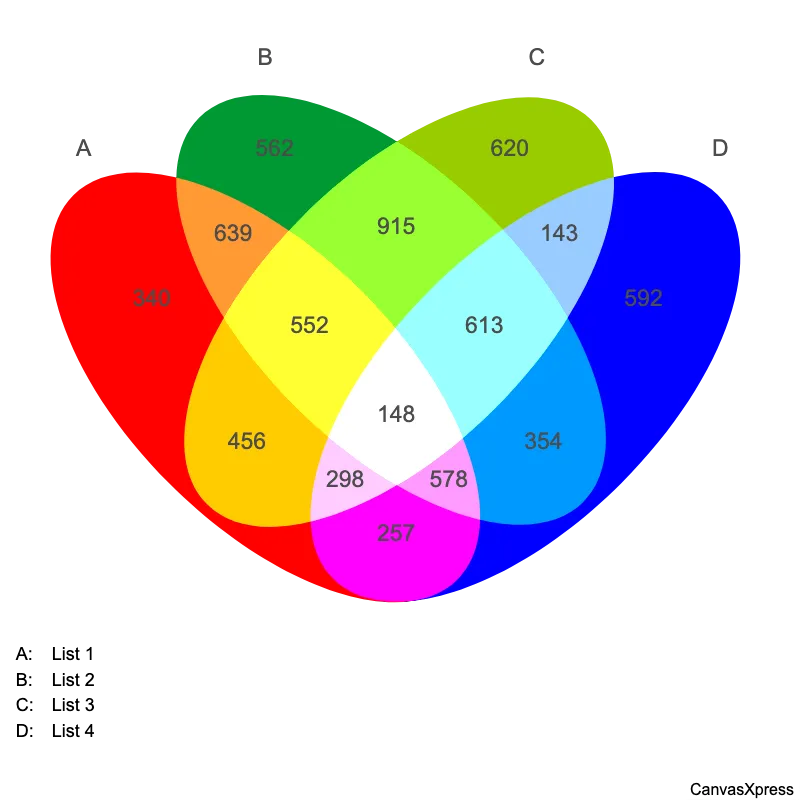
4-Way Venn Diagram for Relationship Visualization
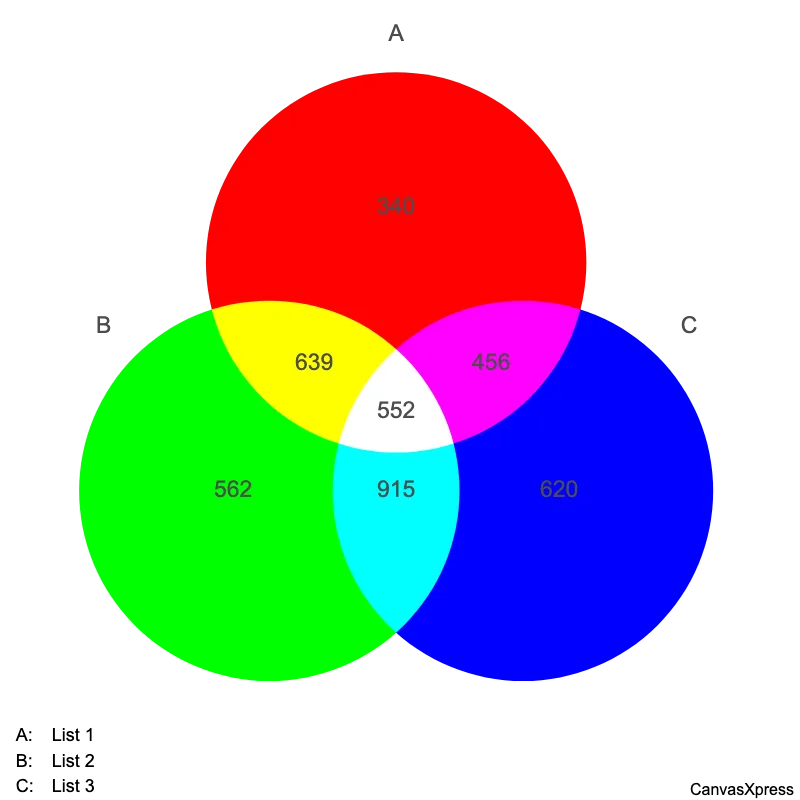
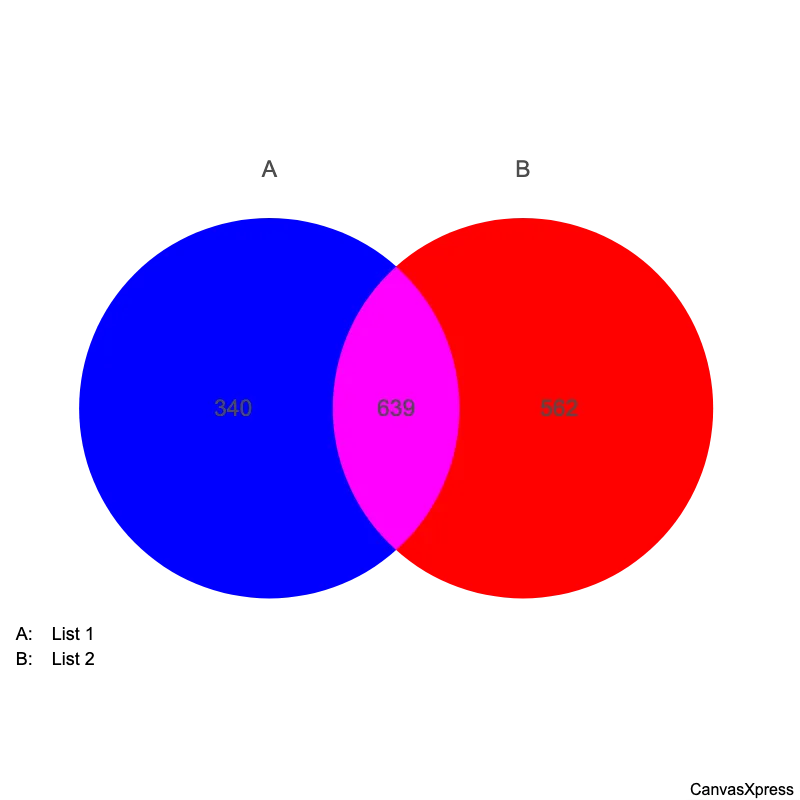
Venn diagrams are visual representations of sets, using overlapping circles to show relationships between groups. They are used to compare and contrast information, making complex data easier to understand. Simple Venn diagrams show two or three sets, but more complex ones can handle many more. Applications are vast, from teaching basic set theory to complex data analysis in fields like biology, engineering, and business. Understanding how to read and create Venn diagrams is a valuable skill for anyone working with data or needing to present information clearly.
<html>

  <head>
    <!-- Include the CanvasXpress library in your HTML file -->
    <link rel="stylesheet" href="https://www.canvasxpress.org/dist/canvasXpress.css" type="text/css"/>
    <script src="https://www.canvasxpress.org/dist/canvasXpress.min.js"></script>
  </head>

  <body>

    <!-- Create a canvas element for the chart with the desired dimensions -->
    <div>
      <canvas id="canvasId" width="600" height="600"></canvas>
    </div>


    <!-- Create a script to initialize the chart -->
    <script>

      // Create the data for the graph
      var data = {
         "venn" : {
            "data" : {
               "A" : 340,
               "AB" : 639,
               "ABC" : 552,
               "ABCD" : 148,
               "ABD" : 578,
               "AC" : 456,
               "ACD" : 298,
               "AD" : 257,
               "B" : 562,
               "BC" : 915,
               "BCD" : 613,
               "BD" : 354,
               "C" : 620,
               "CD" : 143,
               "D" : 592
            },
            "legend" : {
               "A" : "List 1",
               "B" : "List 2",
               "C" : "List 3",
               "D" : "List 4"
            }
         }
      }

      // Create the configuration for the graph
      var config = {
         "graphType" : "Venn",
         "showTransition" : false,
         "vennGroups" : 4
      }

      // Event used to create graph (optional)
      var events = false


      // Call the CanvasXpress function to create the graph
      var cX = new CanvasXpress("canvasId", data, config, events);


    </script>

  </body>

</html>
library(canvasXpress)
canvasXpress(
  vennData=data.frame(A=340, AB=639, ABC=552, ABCD=148, ABD=578, AC=456, ACD=298, AD=257, B=562, BC=915, BCD=613, BD=354, C=620, CD=143, D=592),
  vennLegend=list(A="List 1", B="List 2", C="List 3", D="List 4"),
  graphType="Venn",
  showTransition=FALSE,
  vennGroups=4
)


