Mastering Histograms for Data Analysis
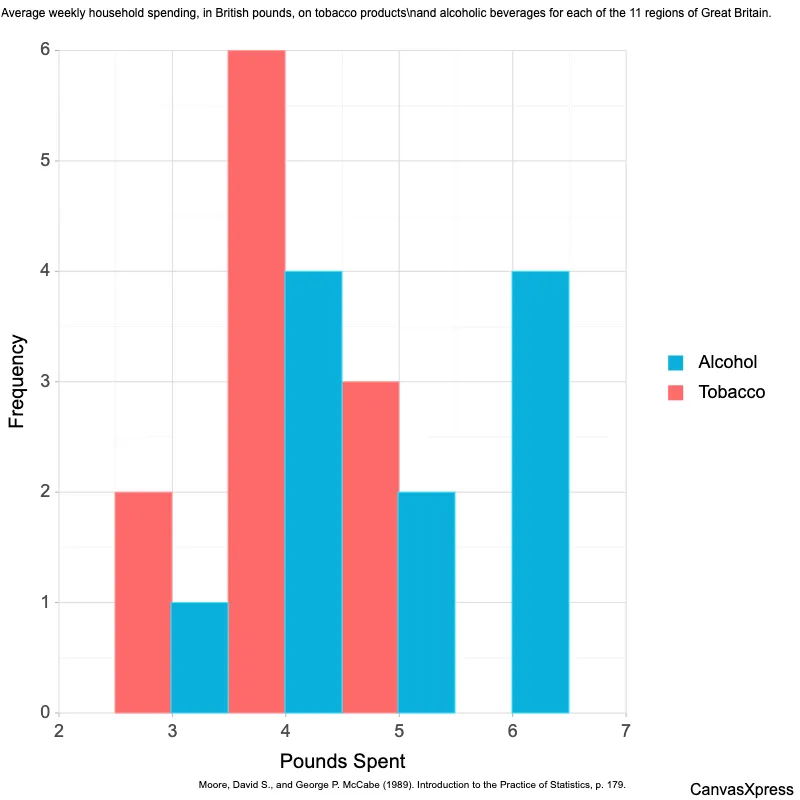
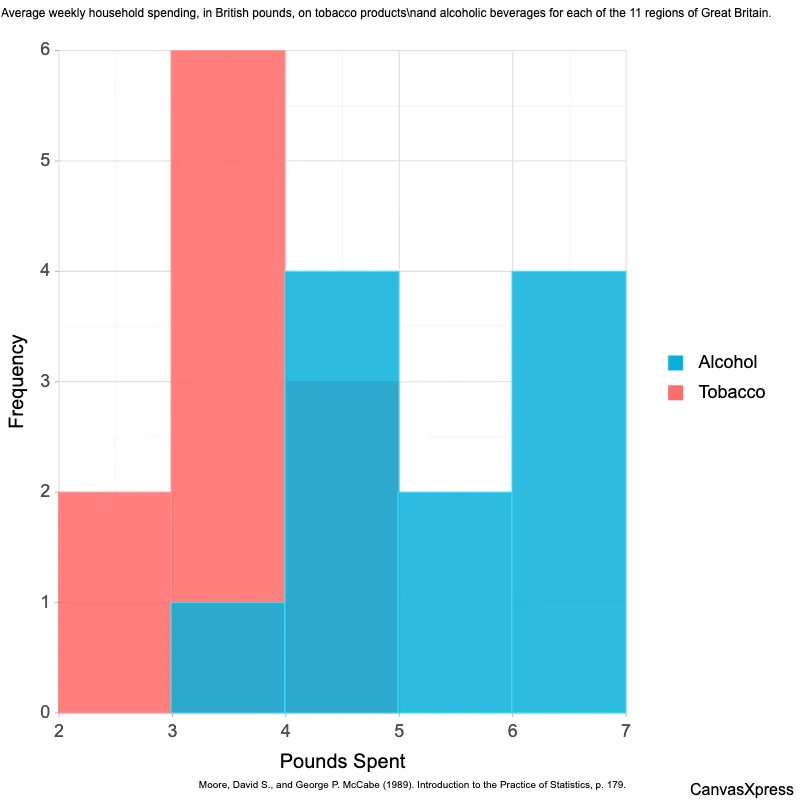
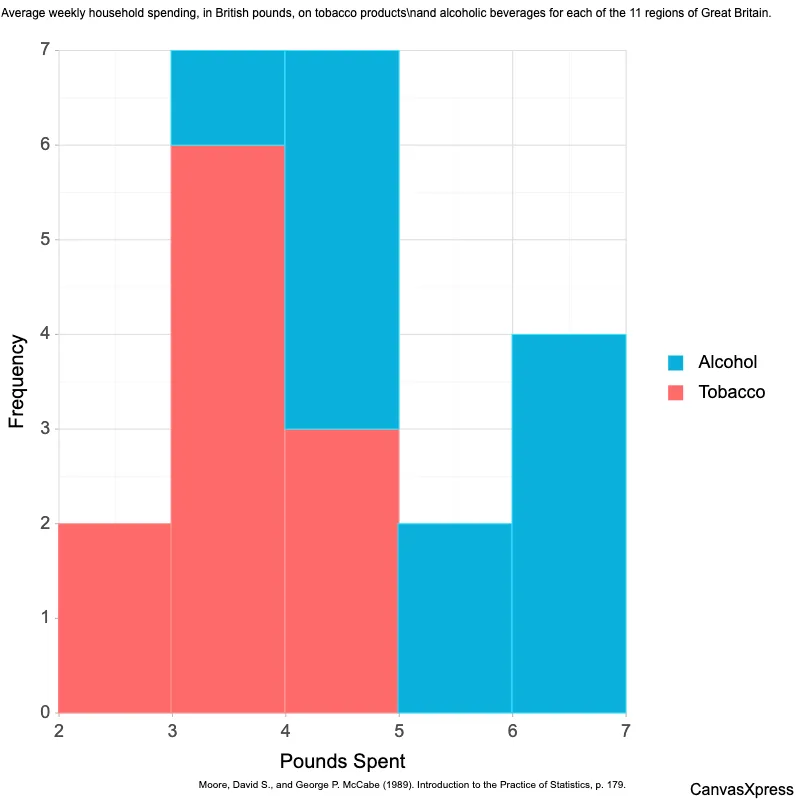
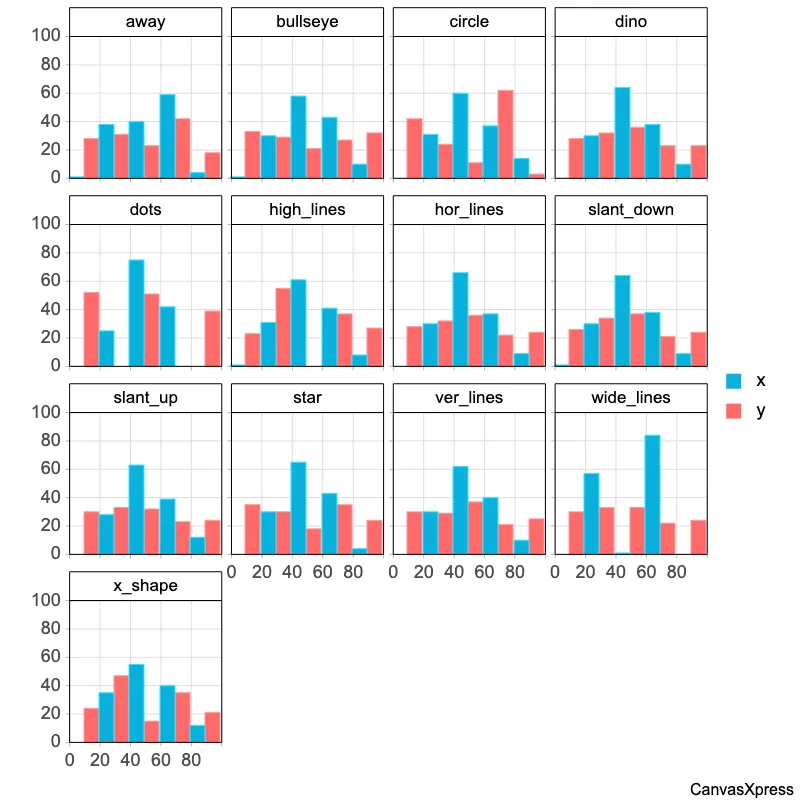
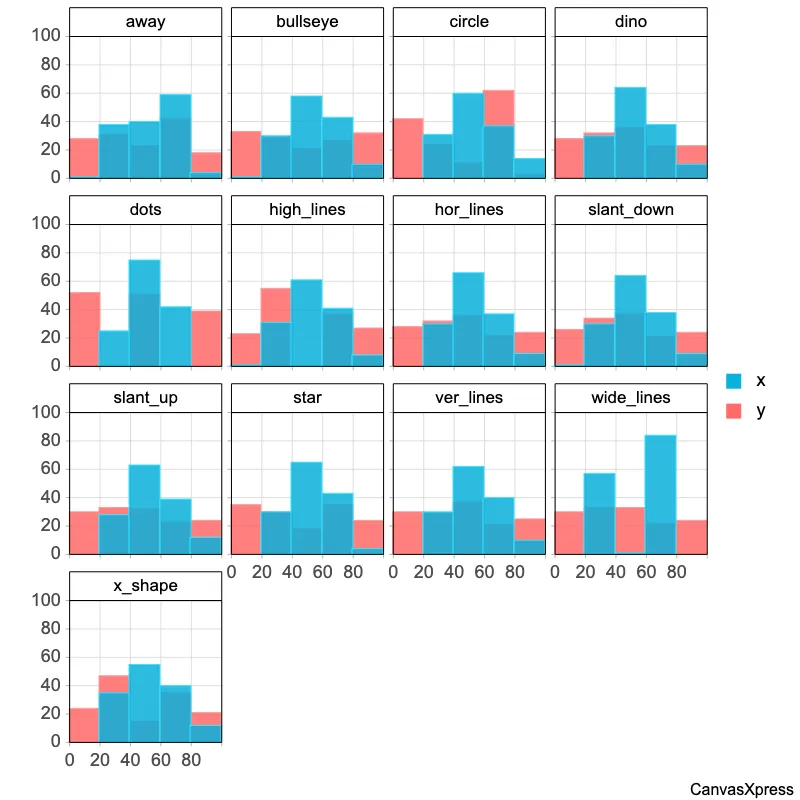
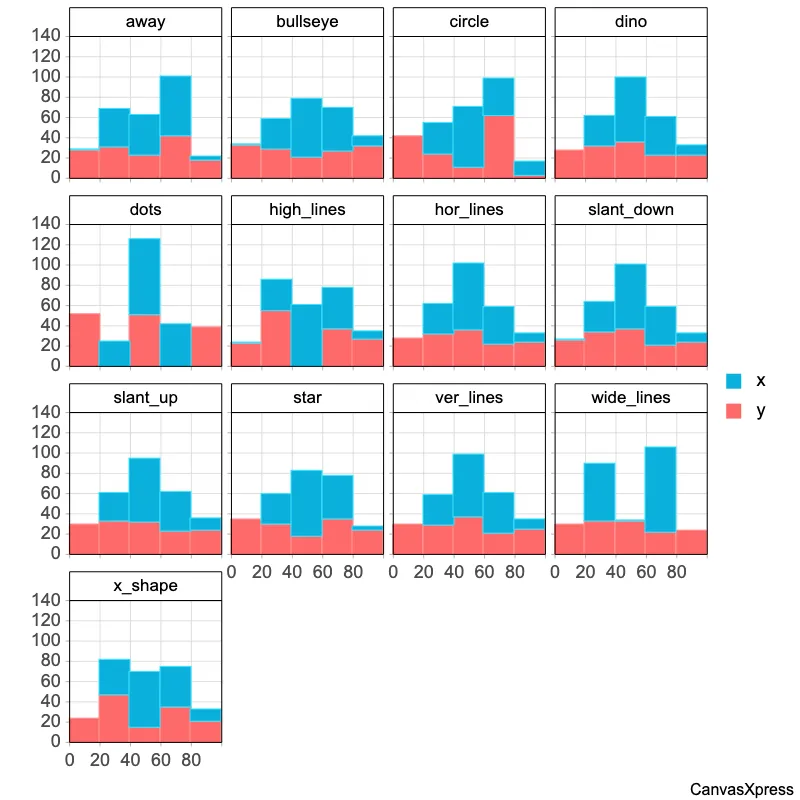
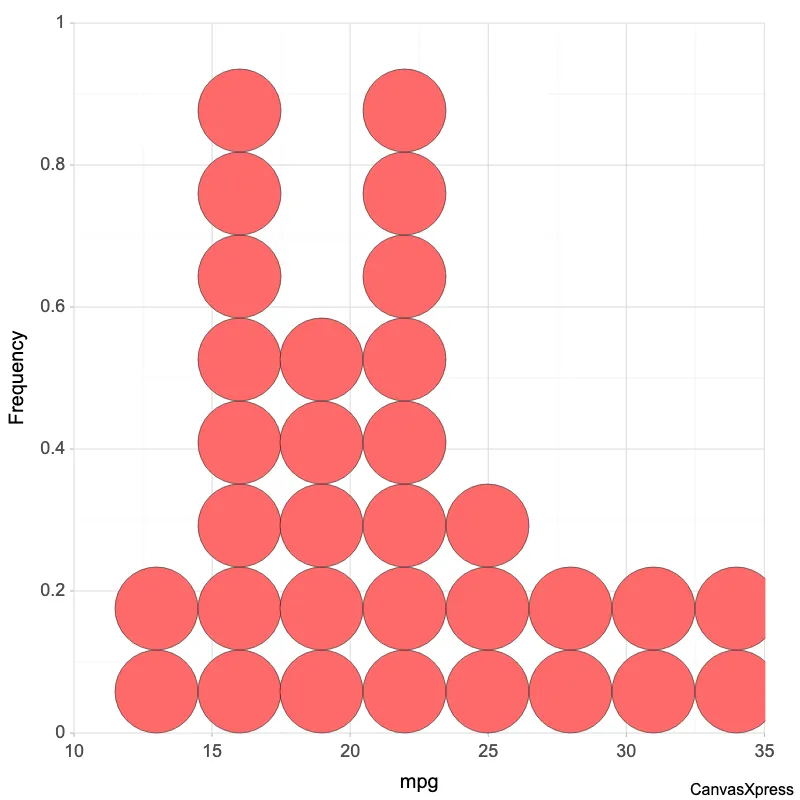
Histograms are powerful visual tools for understanding data distributions. They group data into ranges (bins) and display the frequency of data points within each bin using bars. Histograms are particularly useful for identifying patterns, such as the central tendency, spread, and skewness of a dataset. They are frequently used in statistics and data analysis for exploratory data analysis and to communicate data findings effectively. Creating a histogram involves choosing the appropriate number of bins. Too few bins can obscure important details, while too many can make the histogram appear cluttered and difficult to interpret. Histograms are distinct from bar charts; while both use bars, bar charts compare distinct categories, whereas histograms show the distribution of a continuous variable.
<html>

  <head>
    <!-- Include the CanvasXpress library in your HTML file -->
    <link rel="stylesheet" href="https://www.canvasxpress.org/dist/canvasXpress.css" type="text/css"/>
    <script src="https://www.canvasxpress.org/dist/canvasXpress.min.js"></script>
  </head>

  <body>

    <!-- Create a canvas element for the chart with the desired dimensions -->
    <div>
      <canvas id="canvasId" width="600" height="600"></canvas>
    </div>


    <!-- Create a script to initialize the chart -->
    <script>

      // Use a data frame (2D-array) for the graph
      var data = [
        [ "Id", "Survival", "Organ"],
        [ "s1", 124, "Stomach"],
        [ "s2", 42, "Stomach"],
        [ "s3", 25, "Stomach"],
        [ "s4", 45, "Stomach"],
        [ "s5", 412, "Stomach"],
        [ "s6", 51, "Stomach"],
        [ "s7", 1112, "Stomach"],
        [ "s8", 46, "Stomach"],
        [ "s9", 103, "Stomach"],
        [ "s10", 876, "Stomach"],
        [ "s11", 146, "Stomach"],
        [ "s12", 340, "Stomach"],
        [ "s13", 396, "Stomach"],
        [ "s14", 81, "Bronchus"],
        [ "s15", 461, "Bronchus"],
        [ "s16", 20, "Bronchus"],
        [ "s17", 450, "Bronchus"],
        [ "s18", 246, "Bronchus"],
        [ "s19", 166, "Bronchus"],
        [ "s20", 63, "Bronchus"],
        [ "s21", 64, "Bronchus"],
        [ "s22", 155, "Bronchus"],
        [ "s23", 859, "Bronchus"],
        [ "s24", 151, "Bronchus"],
        [ "s25", 166, "Bronchus"],
        [ "s26", 37, "Bronchus"],
        [ "s27", 223, "Bronchus"],
        [ "s28", 138, "Bronchus"],
        // ... (data truncated after 29 records for clarity)
      ]

      // Create the configuration for the graph
      var config = {
        "axisTitleFontStyle": "italic",
        "citation": "Cameron, E. and Pauling, L. (1978). Proceedings of the National Academy of Science USA, 75.",
        "graphType": "Scatter2D",
        "histogramBins": 10,
        "showHistogram": true,
        "showTransition": false,
        "title": "Patients with advanced cancers of the stomach,\\nbronchus, colon, ovary or breast treated with ascorbate.",
        "xAxis": ["Survival"],
        "xAxisTitle": "Survival (days)",
        "yAxisTitle": "Number of Subjects"
      }

      // Event used to create graph (optional)
      var events = false


      // Call the CanvasXpress function to create the graph
      var cX = new CanvasXpress("canvasId", data, config, events);


    </script>

  </body>

</html>
<html>

  <head>
    <!-- Include the CanvasXpress library in your HTML file -->
    <link rel="stylesheet" href="https://www.canvasxpress.org/dist/canvasXpress.css" type="text/css"/>
    <script src="https://www.canvasxpress.org/dist/canvasXpress.min.js"></script>
  </head>

  <body>

    <!-- Create a canvas element for the chart with the desired dimensions -->
    <div>
      <canvas id="canvasId" width="600" height="600"></canvas>
    </div>


    <!-- Create a script to initialize the chart -->
    <script>

      // Create the data for the graph
      var data = {
         "y" : {
            "data" : [
              [124],
              [42],
              [25],
              [45],
              [412],
              [51],
              [1112],
              [46],
              [103],
              [876],
              [146],
              [340],
              [396],
              [81],
              [461],
              [20],
              [450],
              [246],
              [166],
              [63],
              [64],
              [155],
              [859],
              [151],
              [166],
              [37],
              [223],
              [138],
              [72],
              [245],
              [248],
              [377],
              [189],
              [1843],
              [180],
              [537],
              [519],
              [455],
              [406],
              [365],
              [942],
              [776],
              [372],
              [163],
              [101],
              [20],
              [283],
              [1234],
              [89],
              [201],
              [356],
              [2970],
              [456],
              [1235],
              [24],
              [1581],
              [1166],
              [40],
              [727],
              [3808],
              [791],
              [1804],
              [3460],
              [719]
            ],
            "desc" : ["days"],
            "smps" : ["Survival"],
            "vars" : ["s1","s2","s3","s4","s5","s6","s7","s8","s9","s10","s11","s12","s13","s14","s15","s16","s17","s18","s19","s20","s21","s22","s23","s24","s25","s26","s27","s28","s29","s30","s31","s32","s33","s34","s35","s36","s37","s38","s39","s40","s41","s42","s43","s44","s45","s46","s47","s48","s49","s50","s51","s52","s53","s54","s55","s56","s57","s58","s59","s60","s61","s62","s63","s64"]
         },
         "z" : {
            "Organ" : ["Stomach","Stomach","Stomach","Stomach","Stomach","Stomach","Stomach","Stomach","Stomach","Stomach","Stomach","Stomach","Stomach","Bronchus","Bronchus","Bronchus","Bronchus","Bronchus","Bronchus","Bronchus","Bronchus","Bronchus","Bronchus","Bronchus","Bronchus","Bronchus","Bronchus","Bronchus","Bronchus","Bronchus","Colon","Colon","Colon","Colon","Colon","Colon","Colon","Colon","Colon","Colon","Colon","Colon","Colon","Colon","Colon","Colon","Colon","Ovary","Ovary","Ovary","Ovary","Ovary","Ovary","Breast","Breast","Breast","Breast","Breast","Breast","Breast","Breast","Breast","Breast","Breast"]
         }
      }

      // Create the configuration for the graph
      var config = {
        "axisTitleFontStyle": "italic",
        "citation": "Cameron, E. and Pauling, L. (1978). Proceedings of the National Academy of Science USA, 75.",
        "graphType": "Scatter2D",
        "histogramBins": 10,
        "showHistogram": true,
        "showTransition": false,
        "title": "Patients with advanced cancers of the stomach,\\nbronchus, colon, ovary or breast treated with ascorbate.",
        "xAxis": ["Survival"],
        "xAxisTitle": "Survival (days)",
        "yAxisTitle": "Number of Subjects"
      }

      // Event used to create graph (optional)
      var events = false


      // Call the CanvasXpress function to create the graph
      var cX = new CanvasXpress("canvasId", data, config, events);


    </script>

  </body>

</html>
library(canvasXpress)
y=read.table("https://www.canvasxpress.org/data/r/cX-cancersurvivalt-dat.txt", header=TRUE, sep="\t", quote="", row.names=1, fill=TRUE, check.names=FALSE, stringsAsFactors=FALSE)
z=read.table("https://www.canvasxpress.org/data/r/cX-cancersurvivalt-var.txt", header=TRUE, sep="\t", quote="", row.names=1, fill=TRUE, check.names=FALSE, stringsAsFactors=FALSE)
canvasXpress(
  data=y,
  varAnnot=z,
  axisTitleFontStyle="italic",
  citation="Cameron, E. and Pauling, L. (1978). Proceedings of the National Academy of Science USA, 75.",
  graphType="Scatter2D",
  histogramBins=10,
  showHistogram=TRUE,
  showTransition=FALSE,
  title="Patients with advanced cancers of the stomach,\nbronchus, colon, ovary or breast treated with ascorbate.",
  xAxis=list("Survival"),
  xAxisTitle="Survival (days)",
  yAxisTitle="Number of Subjects"
)


