Data Relationships Visualized in Circular Layout
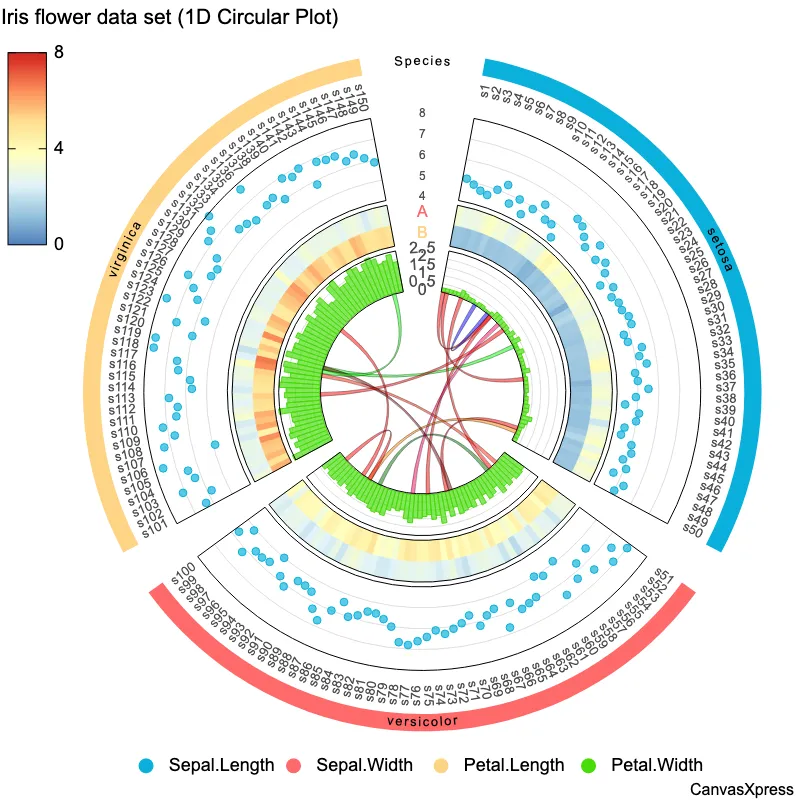
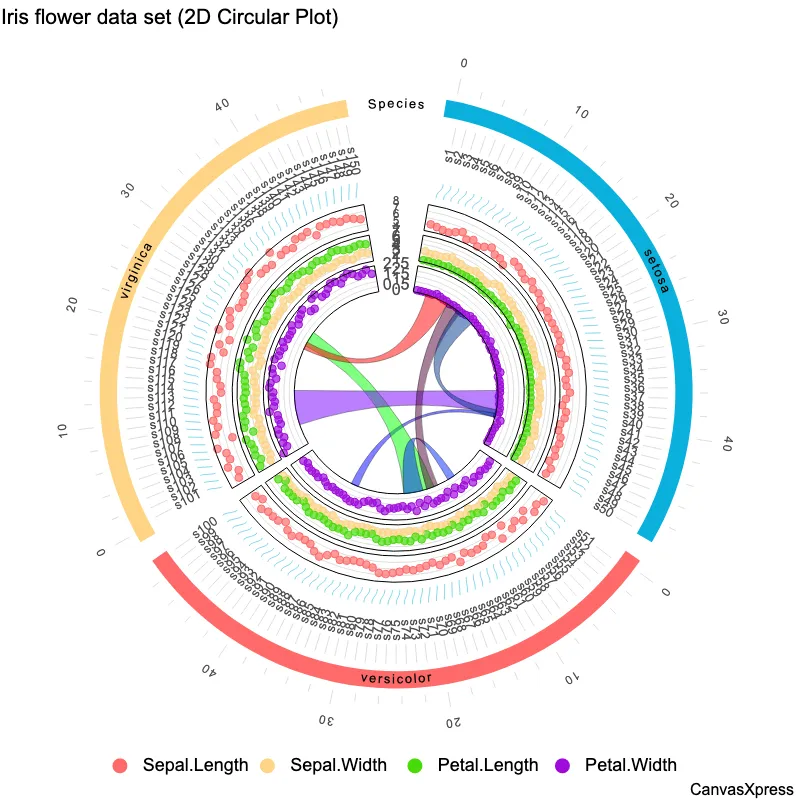
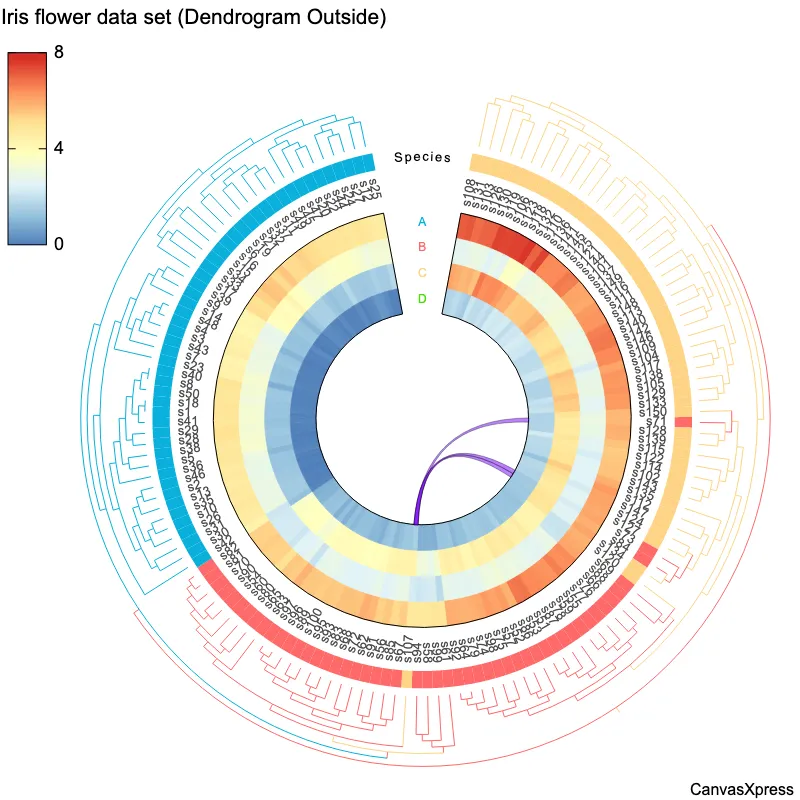
Circular plot or Circus plot is a type of data visualization often used in bioinformatics to display relationships between different genomic elements or datasets. It typically consists of a circular layout, with arcs, ribbons, or links connecting points on the circle to represent relationships or interactions. It is commonly used to show connections between genes, chromosomes, or other biological data in a compact and visually informative way
<html>

  <head>
    <!-- Include the CanvasXpress library in your HTML file -->
    <link rel="stylesheet" href="https://www.canvasxpress.org/dist/canvasXpress.css" type="text/css"/>
    <script src="https://www.canvasxpress.org/dist/canvasXpress.min.js"></script>
  </head>

  <body>

    <!-- Create a canvas element for the chart with the desired dimensions -->
    <div>
      <canvas id="canvasId" width="600" height="600"></canvas>
    </div>


    <!-- Create a script to initialize the chart -->
    <script>

      // Use a data frame (2D-array) for the graph
      var data = [
        [ "Id", "Sepal.Length", "Sepal.Width", "Petal.Length", "Petal.Width", "Species"],
        [ "s1", 5.1, 3.5, 1.4, 0.2, "setosa"],
        [ "s2", 4.9, 3, 1.4, 0.2, "setosa"],
        [ "s3", 4.7, 3.2, 1.3, 0.2, "setosa"],
        [ "s4", 4.6, 3.1, 1.5, 0.2, "setosa"],
        [ "s5", 5, 3.6, 1.4, 0.2, "setosa"],
        [ "s6", 5.4, 3.9, 1.7, 0.4, "setosa"],
        [ "s7", 4.6, 3.4, 1.4, 0.3, "setosa"],
        [ "s8", 5, 3.4, 1.5, 0.2, "setosa"],
        [ "s9", 4.4, 2.9, 1.4, 0.2, "setosa"],
        [ "s10", 4.9, 3.1, 1.5, 0.1, "setosa"],
        [ "s11", 5.4, 3.7, 1.5, 0.2, "setosa"],
        [ "s12", 4.8, 3.4, 1.6, 0.2, "setosa"],
        [ "s13", 4.8, 3, 1.4, 0.1, "setosa"],
        [ "s14", 4.3, 3, 1.1, 0.1, "setosa"],
        [ "s15", 5.8, 4, 1.2, 0.2, "setosa"],
        [ "s16", 5.7, 4.4, 1.5, 0.4, "setosa"],
        [ "s17", 5.4, 3.9, 1.3, 0.4, "setosa"],
        [ "s18", 5.1, 3.5, 1.4, 0.3, "setosa"],
        [ "s19", 5.7, 3.8, 1.7, 0.3, "setosa"],
        [ "s20", 5.1, 3.8, 1.5, 0.3, "setosa"],
        [ "s21", 5.4, 3.4, 1.7, 0.2, "setosa"],
        [ "s22", 5.1, 3.7, 1.5, 0.4, "setosa"],
        [ "s23", 4.6, 3.6, 1, 0.2, "setosa"],
        [ "s24", 5.1, 3.3, 1.7, 0.5, "setosa"],
        [ "s25", 4.8, 3.4, 1.9, 0.2, "setosa"],
        [ "s26", 5, 3, 1.6, 0.2, "setosa"],
        [ "s27", 5, 3.4, 1.6, 0.4, "setosa"],
        [ "s28", 5.2, 3.5, 1.5, 0.2, "setosa"],
        // ... (data truncated after 29 records for clarity)
      ]

      // Create the configuration for the graph
      var config = {
         "circularConnections" : [
            ["rgb(255,0,0)","s1","s15"],
            ["rgb(0,255,0)","s25","s120"],
            ["rgb(255,0,0)","s34","s2"],
            ["rgb(255,0,0)","s47","s69"],
            ["rgb(255,0,0)","s15","s74"],
            ["rgb(0,120,0)","s57","s87"],
            ["rgb(255,34,0)","s54","s118"],
            ["rgb(255,0,100)","s78","s18"],
            ["rgb(255,134,0)","s90","s48"],
            ["rgb(120,0,0)","s120","s68"],
            ["rgb(255,0,0)","s131","s92"],
            ["rgb(0,255,0)","s148","s119"],
            ["rgb(0,0,255)","s10","s14"],
            ["rgb(255,0,0)","s56","s6"],
            ["rgb(255,0,0)","s98","s90"],
            ["rgb(255,0,0)","s113","s20"]
         ],
         "graphType" : "Circular",
         "legendColumns" : 4,
         "legendKeyBackgroundBorderColor" : "rgba(255,255,255,0)",
         "legendKeyBackgroundColor" : "rgba(255,255,255,0)",
         "legendPosition" : "bottom",
         "circularTrackGraphType" : ["dot","heatmap","bar"],
         "circularTrackGraphWeight" : [50,25,25],
         "segregateSamplesBy" : ["Species"],
         "circularTrackName" : ["1","2","2","3"],
         "smpOverlays" : ["Species"],
         "title" : "Iris flower data set (1D Circular Plot)",
         "xAxis" : ["Sepal.Length","Sepal.Width","Petal.Length","Petal.Width"]
      }

      // Event used to create graph (optional)
      var events = false


      // Call the CanvasXpress function to create the graph
      var cX = new CanvasXpress("canvasId", data, config, events);


    </script>

  </body>

</html>
<html>

  <head>
    <!-- Include the CanvasXpress library in your HTML file -->
    <link rel="stylesheet" href="https://www.canvasxpress.org/dist/canvasXpress.css" type="text/css"/>
    <script src="https://www.canvasxpress.org/dist/canvasXpress.min.js"></script>
  </head>

  <body>

    <!-- Create a canvas element for the chart with the desired dimensions -->
    <div>
      <canvas id="canvasId" width="600" height="600"></canvas>
    </div>


    <!-- Create a script to initialize the chart -->
    <script>

      // Create the data for the graph
      var data = {
         "x" : {
            "Species" : ["setosa","setosa","setosa","setosa","setosa","setosa","setosa","setosa","setosa","setosa","setosa","setosa","setosa","setosa","setosa","setosa","setosa","setosa","setosa","setosa","setosa","setosa","setosa","setosa","setosa","setosa","setosa","setosa","setosa","setosa","setosa","setosa","setosa","setosa","setosa","setosa","setosa","setosa","setosa","setosa","setosa","setosa","setosa","setosa","setosa","setosa","setosa","setosa","setosa","setosa","versicolor","versicolor","versicolor","versicolor","versicolor","versicolor","versicolor","versicolor","versicolor","versicolor","versicolor","versicolor","versicolor","versicolor","versicolor","versicolor","versicolor","versicolor","versicolor","versicolor","versicolor","versicolor","versicolor","versicolor","versicolor","versicolor","versicolor","versicolor","versicolor","versicolor","versicolor","versicolor","versicolor","versicolor","versicolor","versicolor","versicolor","versicolor","versicolor","versicolor","versicolor","versicolor","versicolor","versicolor","versicolor","versicolor","versicolor","versicolor","versicolor","versicolor","virginica","virginica","virginica","virginica","virginica","virginica","virginica","virginica","virginica","virginica","virginica","virginica","virginica","virginica","virginica","virginica","virginica","virginica","virginica","virginica","virginica","virginica","virginica","virginica","virginica","virginica","virginica","virginica","virginica","virginica","virginica","virginica","virginica","virginica","virginica","virginica","virginica","virginica","virginica","virginica","virginica","virginica","virginica","virginica","virginica","virginica","virginica","virginica","virginica","virginica"]
         },
         "y" : {
            "data" : [
              [5.1,4.9,4.7,4.6,5,5.4,4.6,5,4.4,4.9,5.4,4.8,4.8,4.3,5.8,5.7,5.4,5.1,5.7,5.1,5.4,5.1,4.6,5.1,4.8,5,5,5.2,5.2,4.7,4.8,5.4,5.2,5.5,4.9,5,5.5,4.9,4.4,5.1,5,4.5,4.4,5,5.1,4.8,5.1,4.6,5.3,5,7,6.4,6.9,5.5,6.5,5.7,6.3,4.9,6.6,5.2,5,5.9,6,6.1,5.6,6.7,5.6,5.8,6.2,5.6,5.9,6.1,6.3,6.1,6.4,6.6,6.8,6.7,6,5.7,5.5,5.5,5.8,6,5.4,6,6.7,6.3,5.6,5.5,5.5,6.1,5.8,5,5.6,5.7,5.7,6.2,5.1,5.7,6.3,5.8,7.1,6.3,6.5,7.6,4.9,7.3,6.7,7.2,6.5,6.4,6.8,5.7,5.8,6.4,6.5,7.7,7.7,6,6.9,5.6,7.7,6.3,6.7,7.2,6.2,6.1,6.4,7.2,7.4,7.9,6.4,6.3,6.1,7.7,6.3,6.4,6,6.9,6.7,6.9,5.8,6.8,6.7,6.7,6.3,6.5,6.2,5.9],
              [3.5,3,3.2,3.1,3.6,3.9,3.4,3.4,2.9,3.1,3.7,3.4,3,3,4,4.4,3.9,3.5,3.8,3.8,3.4,3.7,3.6,3.3,3.4,3,3.4,3.5,3.4,3.2,3.1,3.4,4.1,4.2,3.1,3.2,3.5,3.6,3,3.4,3.5,2.3,3.2,3.5,3.8,3,3.8,3.2,3.7,3.3,3.2,3.2,3.1,2.3,2.8,2.8,3.3,2.4,2.9,2.7,2,3,2.2,2.9,2.9,3.1,3,2.7,2.2,2.5,3.2,2.8,2.5,2.8,2.9,3,2.8,3,2.9,2.6,2.4,2.4,2.7,2.7,3,3.4,3.1,2.3,3,2.5,2.6,3,2.6,2.3,2.7,3,2.9,2.9,2.5,2.8,3.3,2.7,3,2.9,3,3,2.5,2.9,2.5,3.6,3.2,2.7,3,2.5,2.8,3.2,3,3.8,2.6,2.2,3.2,2.8,2.8,2.7,3.3,3.2,2.8,3,2.8,3,2.8,3.8,2.8,2.8,2.6,3,3.4,3.1,3,3.1,3.1,3.1,2.7,3.2,3.3,3,2.5,3,3.4,3],
              [1.4,1.4,1.3,1.5,1.4,1.7,1.4,1.5,1.4,1.5,1.5,1.6,1.4,1.1,1.2,1.5,1.3,1.4,1.7,1.5,1.7,1.5,1,1.7,1.9,1.6,1.6,1.5,1.4,1.6,1.6,1.5,1.5,1.4,1.5,1.2,1.3,1.4,1.3,1.5,1.3,1.3,1.3,1.6,1.9,1.4,1.6,1.4,1.5,1.4,4.7,4.5,4.9,4,4.6,4.5,4.7,3.3,4.6,3.9,3.5,4.2,4,4.7,3.6,4.4,4.5,4.1,4.5,3.9,4.8,4,4.9,4.7,4.3,4.4,4.8,5,4.5,3.5,3.8,3.7,3.9,5.1,4.5,4.5,4.7,4.4,4.1,4,4.4,4.6,4,3.3,4.2,4.2,4.2,4.3,3,4.1,6,5.1,5.9,5.6,5.8,6.6,4.5,6.3,5.8,6.1,5.1,5.3,5.5,5,5.1,5.3,5.5,6.7,6.9,5,5.7,4.9,6.7,4.9,5.7,6,4.8,4.9,5.6,5.8,6.1,6.4,5.6,5.1,5.6,6.1,5.6,5.5,4.8,5.4,5.6,5.1,5.1,5.9,5.7,5.2,5,5.2,5.4,5.1],
              [0.2,0.2,0.2,0.2,0.2,0.4,0.3,0.2,0.2,0.1,0.2,0.2,0.1,0.1,0.2,0.4,0.4,0.3,0.3,0.3,0.2,0.4,0.2,0.5,0.2,0.2,0.4,0.2,0.2,0.2,0.2,0.4,0.1,0.2,0.2,0.2,0.2,0.1,0.2,0.2,0.3,0.3,0.2,0.6,0.4,0.3,0.2,0.2,0.2,0.2,1.4,1.5,1.5,1.3,1.5,1.3,1.6,1,1.3,1.4,1,1.5,1,1.4,1.3,1.4,1.5,1,1.5,1.1,1.8,1.3,1.5,1.2,1.3,1.4,1.4,1.7,1.5,1,1.1,1,1.2,1.6,1.5,1.6,1.5,1.3,1.3,1.3,1.2,1.4,1.2,1,1.3,1.2,1.3,1.3,1.1,1.3,2.5,1.9,2.1,1.8,2.2,2.1,1.7,1.8,1.8,2.5,2,1.9,2.1,2,2.4,2.3,1.8,2.2,2.3,1.5,2.3,2,2,1.8,2.1,1.8,1.8,1.8,2.1,1.6,1.9,2,2.2,1.5,1.4,2.3,2.4,1.8,1.8,2.1,2.4,2.3,1.9,2.3,2.5,2.3,1.9,2,2.3,1.8]
            ],
            "desc" : ["centimeters"],
            "smps" : ["s1","s2","s3","s4","s5","s6","s7","s8","s9","s10","s11","s12","s13","s14","s15","s16","s17","s18","s19","s20","s21","s22","s23","s24","s25","s26","s27","s28","s29","s30","s31","s32","s33","s34","s35","s36","s37","s38","s39","s40","s41","s42","s43","s44","s45","s46","s47","s48","s49","s50","s51","s52","s53","s54","s55","s56","s57","s58","s59","s60","s61","s62","s63","s64","s65","s66","s67","s68","s69","s70","s71","s72","s73","s74","s75","s76","s77","s78","s79","s80","s81","s82","s83","s84","s85","s86","s87","s88","s89","s90","s91","s92","s93","s94","s95","s96","s97","s98","s99","s100","s101","s102","s103","s104","s105","s106","s107","s108","s109","s110","s111","s112","s113","s114","s115","s116","s117","s118","s119","s120","s121","s122","s123","s124","s125","s126","s127","s128","s129","s130","s131","s132","s133","s134","s135","s136","s137","s138","s139","s140","s141","s142","s143","s144","s145","s146","s147","s148","s149","s150"],
            "vars" : ["Sepal.Length","Sepal.Width","Petal.Length","Petal.Width"]
         },
         "z" : {
            "Ring" : [1,2,2,3]
         }
      }

      // Create the configuration for the graph
      var config = {
         "circularConnections" : [
            ["rgb(255,0,0)","s1","s15"],
            ["rgb(0,255,0)","s25","s120"],
            ["rgb(255,0,0)","s34","s2"],
            ["rgb(255,0,0)","s47","s69"],
            ["rgb(255,0,0)","s15","s74"],
            ["rgb(0,120,0)","s57","s87"],
            ["rgb(255,34,0)","s54","s118"],
            ["rgb(255,0,100)","s78","s18"],
            ["rgb(255,134,0)","s90","s48"],
            ["rgb(120,0,0)","s120","s68"],
            ["rgb(255,0,0)","s131","s92"],
            ["rgb(0,255,0)","s148","s119"],
            ["rgb(0,0,255)","s10","s14"],
            ["rgb(255,0,0)","s56","s6"],
            ["rgb(255,0,0)","s98","s90"],
            ["rgb(255,0,0)","s113","s20"]
         ],
         "graphType" : "Circular",
         "legendColumns" : 4,
         "legendKeyBackgroundBorderColor" : "rgba(255,255,255,0)",
         "legendKeyBackgroundColor" : "rgba(255,255,255,0)",
         "legendPosition" : "bottom",
         "circularTrackGraphType" : ["dot","heatmap","bar"],
         "circularTrackGraphWeight" : [50,25,25],
         "segregateSamplesBy" : ["Species"],
         "circularTrackName" : ["1","2","2","3"],
         "smpOverlays" : ["Species"],
         "title" : "Iris flower data set (1D Circular Plot)",
         "xAxis" : ["Sepal.Length","Sepal.Width","Petal.Length","Petal.Width"]
      }

      // Event used to create graph (optional)
      var events = false


      // Call the CanvasXpress function to create the graph
      var cX = new CanvasXpress("canvasId", data, config, events);


    </script>

  </body>

</html>
library(canvasXpress)
y=read.table("https://www.canvasxpress.org/data/r/cX-circular-dat.txt", header=TRUE, sep="\t", quote="", row.names=1, fill=TRUE, check.names=FALSE, stringsAsFactors=FALSE)
x=read.table("https://www.canvasxpress.org/data/r/cX-circular-smp.txt", header=TRUE, sep="\t", quote="", row.names=1, fill=TRUE, check.names=FALSE, stringsAsFactors=FALSE)
z=read.table("https://www.canvasxpress.org/data/r/cX-circular-var.txt", header=TRUE, sep="\t", quote="", row.names=1, fill=TRUE, check.names=FALSE, stringsAsFactors=FALSE)
canvasXpress(
  data=y,
  smpAnnot=x,
  varAnnot=z,
  circularConnections=list(list("rgb(255,0,0)", "s1", "s15"), list("rgb(0,255,0)", "s25", "s120"), list("rgb(255,0,0)", "s34", "s2"), list("rgb(255,0,0)", "s47", "s69"), list("rgb(255,0,0)", "s15", "s74"), list("rgb(0,120,0)", "s57", "s87"), list("rgb(255,34,0)", "s54", "s118"), list("rgb(255,0,100)", "s78", "s18"), list("rgb(255,134,0)", "s90", "s48"), list("rgb(120,0,0)", "s120", "s68"), list("rgb(255,0,0)", "s131", "s92"), list("rgb(0,255,0)", "s148", "s119"), list("rgb(0,0,255)", "s10", "s14"), list("rgb(255,0,0)", "s56", "s6"), list("rgb(255,0,0)", "s98", "s90"), list("rgb(255,0,0)", "s113", "s20")),
  circularTrackGraphType=list("dot", "heatmap", "bar"),
  circularTrackGraphWeight=list(50, 25, 25),
  circularTrackName=list(1, 2, 2, 3),
  graphType="Circular",
  legendColumns=4,
  legendKeyBackgroundBorderColor="rgba(255,255,255,0)",
  legendKeyBackgroundColor="rgba(255,255,255,0)",
  legendPosition="bottom",
  segregateSamplesBy=list("Species"),
  smpOverlays=list("Species"),
  title="Iris flower data set (1D Circular Plot)",
  xAxis=list("Sepal.Length", "Sepal.Width", "Petal.Length", "Petal.Width")
)


