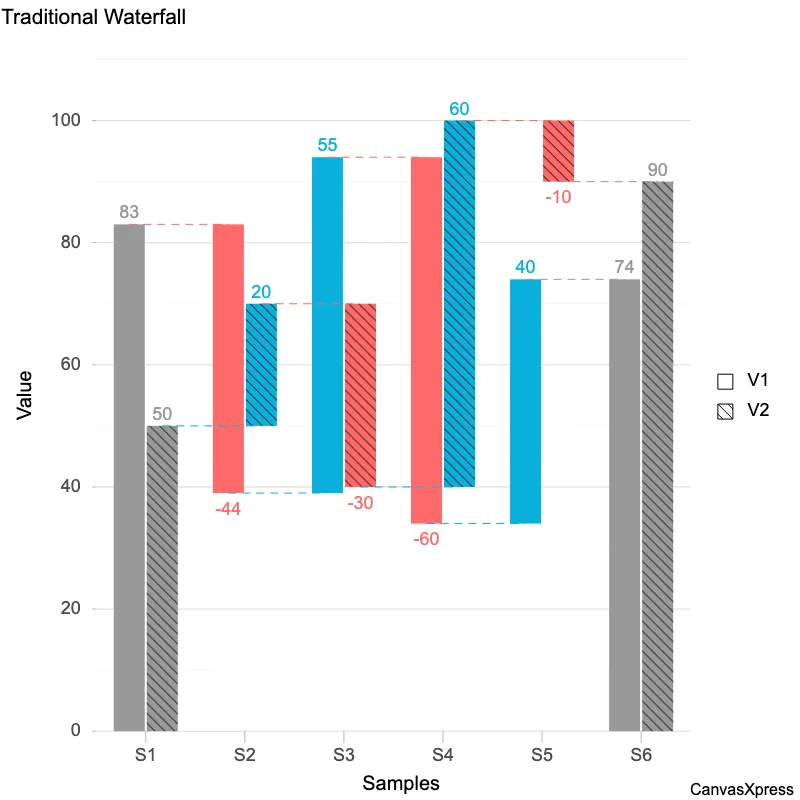
Waterfall Graph: Cumulative Variables Visualized
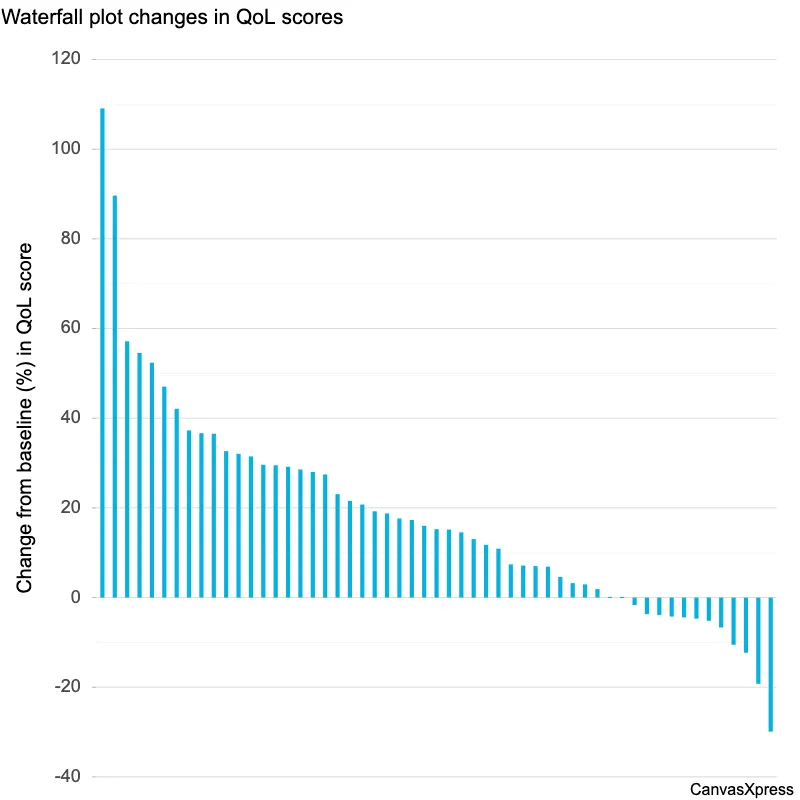
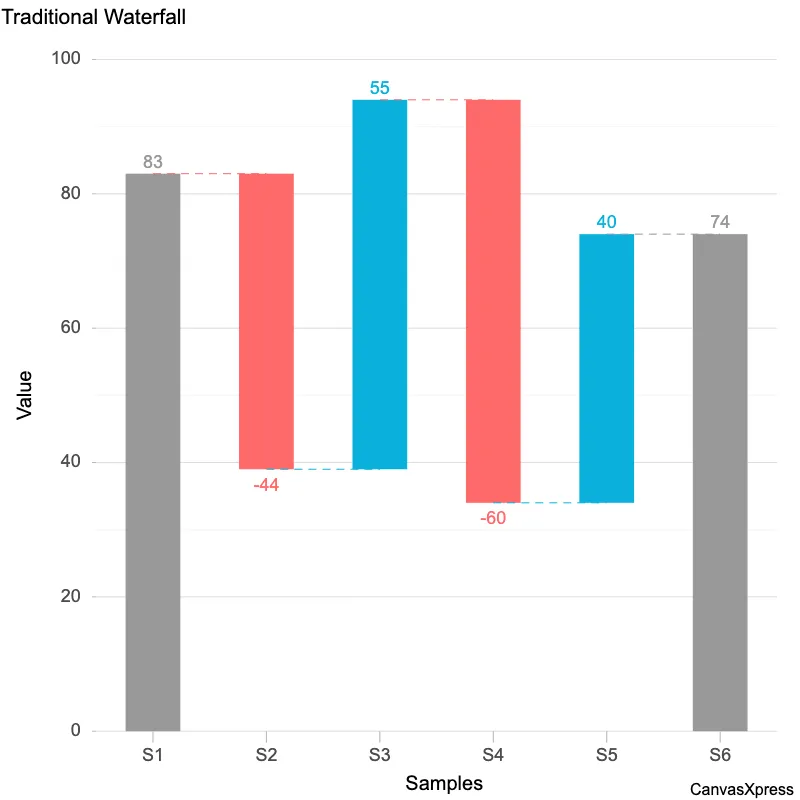
Waterfall graphs provide a clear, visual representation of data over time, making them ideal for tracking project progress or budget allocation. They are particularly useful for illustrating cumulative effects, showing how individual components contribute to a final total. Understanding waterfall charts enhances data interpretation, leading to better decision-making across various fields, from finance to software development. Their simplicity facilitates quick comprehension of complex datasets, enabling effective communication of key trends and insights.
<html>

  <head>
    <!-- Include the CanvasXpress library in your HTML file -->
    <link rel="stylesheet" href="https://www.canvasxpress.org/dist/canvasXpress.css" type="text/css"/>
    <script src="https://www.canvasxpress.org/dist/canvasXpress.min.js"></script>
  </head>

  <body>

    <!-- Create a canvas element for the chart with the desired dimensions -->
    <div>
      <canvas id="canvasId" width="600" height="600"></canvas>
    </div>


    <!-- Create a script to initialize the chart -->
    <script>

      // Use a data frame (2D-array) for the graph
      var data = [
        [ "Id", "QoL-Score", "Treatment"],
        [ "Sub-253", 109.09, "Trt-2"],
        [ "Sub-337", 89.65, "Trt-2"],
        [ "Sub-193", 57.14, "Trt-2"],
        [ "Sub-313", 54.54, "Trt-2"],
        [ "Sub-217", 52.38, "Trt-2"],
        [ "Sub-37", 47.05, "Trt-1"],
        [ "Sub-169", 42.1, "Trt-1"],
        [ "Sub-55", 37.28, "Trt-1"],
        [ "Sub-19", 36.66, "Trt-1"],
        [ "Sub-145", 36.53, "Trt-1"],
        [ "Sub-103", 32.65, "Trt-1"],
        [ "Sub-49", 32.07, "Trt-1"],
        [ "Sub-205", 31.48, "Trt-2"],
        [ "Sub-97", 29.62, "Trt-1"],
        [ "Sub-79", 29.5, "Trt-1"],
        [ "Sub-67", 29.16, "Trt-1"],
        [ "Sub-115", 28.57, "Trt-1"],
        [ "Sub-325", 28, "Trt-2"],
        [ "Sub-43", 27.45, "Trt-1"],
        [ "Sub-109", 23.07, "Trt-1"],
        [ "Sub-91", 21.56, "Trt-1"],
        [ "Sub-157", 20.75, "Trt-1"],
        [ "Sub-151", 19.23, "Trt-1"],
        [ "Sub-343", 18.75, "Trt-2"],
        [ "Sub-139", 17.64, "Trt-1"],
        [ "Sub-319", 17.3, "Trt-2"],
        [ "Sub-85", 16, "Trt-1"],
        [ "Sub-181", 15.25, "Trt-2"],
        // ... (data truncated after 29 records for clarity)
      ]

      // Create the configuration for the graph
      var config = {
         "graphOrientation" : "vertical",
         "graphType" : "Bar",
         "showLegend" : false,
         "showSampleNames" : false,
         "title" : "Waterfall plot changes in QoL scores",
         "xAxisTitle" : "Change from baseline (%) in QoL score",
         "xAxis" : ["QoL-Score"]
      }

      // Event used to create graph (optional)
      var events = false


      // Call the CanvasXpress function to create the graph
      var cX = new CanvasXpress("canvasId", data, config, events);


    </script>

  </body>

</html>
<html>

  <head>
    <!-- Include the CanvasXpress library in your HTML file -->
    <link rel="stylesheet" href="https://www.canvasxpress.org/dist/canvasXpress.css" type="text/css"/>
    <script src="https://www.canvasxpress.org/dist/canvasXpress.min.js"></script>
  </head>

  <body>

    <!-- Create a canvas element for the chart with the desired dimensions -->
    <div>
      <canvas id="canvasId" width="600" height="600"></canvas>
    </div>


    <!-- Create a script to initialize the chart -->
    <script>

      // Create the data for the graph
      var data = {
         "x" : {
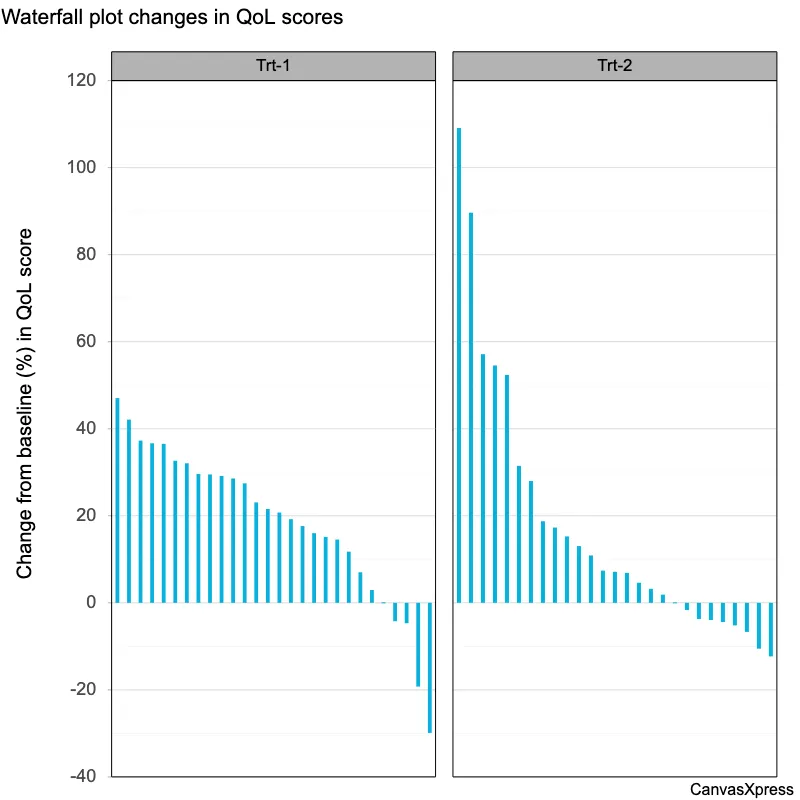
            "Treatment" : ["Trt-2","Trt-2","Trt-2","Trt-2","Trt-2","Trt-1","Trt-1","Trt-1","Trt-1","Trt-1","Trt-1","Trt-1","Trt-2","Trt-1","Trt-1","Trt-1","Trt-1","Trt-2","Trt-1","Trt-1","Trt-1","Trt-1","Trt-1","Trt-2","Trt-1","Trt-2","Trt-1","Trt-2","Trt-1","Trt-1","Trt-2","Trt-1","Trt-2","Trt-2","Trt-2","Trt-1","Trt-2","Trt-2","Trt-2","Trt-1","Trt-2","Trt-1","Trt-2","Trt-2","Trt-2","Trt-2","Trt-1","Trt-2","Trt-1","Trt-2","Trt-2","Trt-2","Trt-2","Trt-1","Trt-1"]
         },
         "y" : {
            "data" : [
              [109.09,89.65,57.14,54.54,52.38,47.05,42.1,37.28,36.66,36.53,32.65,32.07,31.48,29.62,29.5,29.16,28.57,28,27.45,23.07,21.56,20.75,19.23,18.75,17.64,17.3,16,15.25,15.15,14.54,13.04,11.76,10.9,7.4,7.14,7.01,6.89,4.61,3.22,2.94,1.88,0,0,-1.67,-3.71,-3.93,-4.23,-4.42,-4.69,-5.18,-6.67,-10.53,-12.31,-19.24,-29.89]
            ],
            "smps" : ["Sub-253","Sub-337","Sub-193","Sub-313","Sub-217","Sub-37","Sub-169","Sub-55","Sub-19","Sub-145","Sub-103","Sub-49","Sub-205","Sub-97","Sub-79","Sub-67","Sub-115","Sub-325","Sub-43","Sub-109","Sub-91","Sub-157","Sub-151","Sub-343","Sub-139","Sub-319","Sub-85","Sub-181","Sub-175","Sub-127","Sub-271","Sub-163","Sub-211","Sub-187","Sub-307","Sub-73","Sub-229","Sub-235","Sub-241","Sub-31","Sub-223","Sub-25","Sub-295","Sub-301","Sub-265","Sub-331","Sub-121","Sub-199","Sub-133","Sub-259","Sub-277","Sub-355","Sub-283","Sub-1","Sub-61"],
            "vars" : ["QoL-Score"]
         }
      }

      // Create the configuration for the graph
      var config = {
         "graphOrientation" : "vertical",
         "graphType" : "Bar",
         "showLegend" : false,
         "showSampleNames" : false,
         "title" : "Waterfall plot changes in QoL scores",
         "xAxisTitle" : "Change from baseline (%) in QoL score",
         "xAxis" : ["QoL-Score"]
      }

      // Event used to create graph (optional)
      var events = false


      // Call the CanvasXpress function to create the graph
      var cX = new CanvasXpress("canvasId", data, config, events);


    </script>

  </body>

</html>
library(canvasXpress)
y=read.table("https://www.canvasxpress.org/data/r/cX-waterfall-dat.txt", header=TRUE, sep="\t", quote="", row.names=1, fill=TRUE, check.names=FALSE, stringsAsFactors=FALSE)
x=read.table("https://www.canvasxpress.org/data/r/cX-waterfall-smp.txt", header=TRUE, sep="\t", quote="", row.names=1, fill=TRUE, check.names=FALSE, stringsAsFactors=FALSE)
canvasXpress(
  data=y,
  smpAnnot=x,
  graphOrientation="vertical",
  graphType="Bar",
  showLegend=FALSE,
  showSampleNames=FALSE,
  title="Waterfall plot changes in QoL scores",
  xAxis=list("QoL-Score"),
  xAxisTitle="Change from baseline (%) in QoL score"
)
