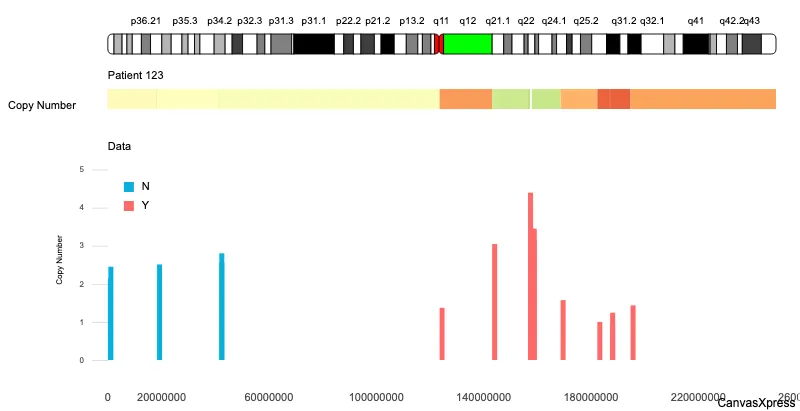
Genomics Visualization with Ideograms
Genome graphs represent a revolutionary advancement in genomics, moving beyond linear reference genomes to encompass the vast diversity of genomic variation within populations. These complex data structures integrate multiple genome sequences, enabling more accurate and comprehensive analysis of genetic information. Applications range from improving disease diagnostics to facilitating more effective personalized medicine, as genome graphs provide a richer context for understanding individual genetic differences and their implications for health. This technology offers significant potential for advancing biological and medical research.
<html>

  <head>
    <!-- Include the CanvasXpress library in your HTML file -->
    <link rel="stylesheet" href="https://www.canvasxpress.org/dist/canvasXpress.css" type="text/css"/>
    <script src="https://www.canvasxpress.org/dist/canvasXpress.min.js"></script>
  </head>

  <body>

    <!-- Create a canvas element for the chart with the desired dimensions -->
    <div>
      <canvas id="canvasId" width="600" height="600"></canvas>
    </div>


    <!-- Create a script to initialize the chart -->
    <script>

      // Create the data for the graph
      var data = {
         "tracks" : [{"data" : [{"colorBy" : [2.1435,2.4487,2.0871,2.5089,2.7998,2.5607,1.3707,3.0451,3.1856,3.4828,4.2085,4.3929,3.2331,3.4452,3.2047,3.4436,3.1231,1.5717,1.0007,1.2406,0.9875,1.4343],
                     "data" : [
              [1,190777],
                       [190778,18336050],
                       [18336051,18336136],
                       [18336137,41527209],
                       [41527210,41527300],
                       [41527301,123605522],
                       [123605523,143198862],
                       [143198863,156568907],
                       [156568908,156568909],
                       [156568910,156568955],
                       [156568956,156568982],
                       [156568983,156569015],
                       [156569016,157324277],
                       [157324278,157360521],
                       [157360522,157952881],
                       [157952882,157952897],
                       [157952898,168696909],
                       [168696910,182387818],
                       [182387819,187155854],
                       [187155855,187156488],
                       [187156489,194772657],
                       [194772658,248956422]
                     ],
                     "id" : "Copy Number",
                     "spectrum" : ["#d7191c","#fdae61","#ffffbf","#a6d96a","#1a9641"]
                  }
               ],
               "height" : 20,
               "name" : "Patient 123",
               "type" : "box"
            },
            {
               "data" : [{"data" : [{"colorBy" : "lohs","fill" : "green","side" : "left","title" : "Copy Number","type" : "bar","xAxis" : "start","yAxis" : "cn"}],
                     "id" : "Data-frame",
                     "offset" : 10
                  }
               ],
               "dataframe" : {
                  "cn" : [2.1435,2.4487,2.0871,2.5089,2.7998,2.5607,1.3707,3.0451,3.1856,3.4828,4.2085,4.3929,3.2331,3.4452,3.2047,3.4436,3.1231,1.5717,1.0007,1.2406,0.9875,1.4343],
                  "label" : ["CN :  2.1435","CN :  2.4487","CN :  2.0871","CN :  2.5089","CN :  2.7998","CN :  2.5607","CN :  1.3707","CN :  3.0451","CN :  3.1856","CN :  3.4828","CN :  4.2085","CN :  4.3929","CN :  3.2331","CN :  3.4452","CN :  3.2047","CN :  3.4436","CN :  3.1231","CN :  1.5717","CN :  1.0007","CN :  1.2406","CN :  0.9875","CN :  1.4343"],
                  "len" : [190776,18145272,85,23191072,90,82078221,19593339,13370044,1,45,26,32,755261,36243,592359,15,10744011,13690908,4768035,633,7616168,54183764],
                  "loh" : [0,0,0,0,0,0,1,1,1,1,1,1,1,1,1,1,1,1,1,1,1,1],
                  "lohs" : ["N","N","N","N","N","N","Y","Y","Y","Y","Y","Y","Y","Y","Y","Y","Y","Y","Y","Y","Y","Y"],
                  "path" : [-1,-1,-1,-1,-1,-1,-1,-1,-1,-1,-1,-1,-1,-1,-1,-1,-1,-1,-1,-1,-1,-1],
                  "start" : [1,190778,18336051,18336137,41527210,41527301,123605523,143198863,156568908,156568910,156568956,156568983,156569016,157324278,157360522,157952882,157952898,168696910,182387819,187155855,187156489,194772658]
               },
               "height" : 200,
               "name" : "Data",
               "type" : "dataframe"
            }
         ]
      }

      // Create the configuration for the graph
      var config = {
         "background" : "rgb(245,245,245)",
         "graphType" : "Genome",
         "ideogramShowFullChromosome" : true,
         "showIdeogram" : true
      }

      // Event used to create graph (optional)
      var events = false


      // Call the CanvasXpress function to create the graph
      var cX = new CanvasXpress("canvasId", data, config, events);


    </script>

  </body>

</html>
library(canvasXpress)
library(jsonlite)
genome <- read_json("https://www.canvasxpress.org/data/r/cX-genomeideogram.json")
canvasXpress(
  data=genome,
  background="rgb(245,245,245)",
  graphType="Genome",
  ideogramShowFullChromosome=TRUE,
  showIdeogram=TRUE
)


