Kaplan-Meier Survival Plot with Counting Method
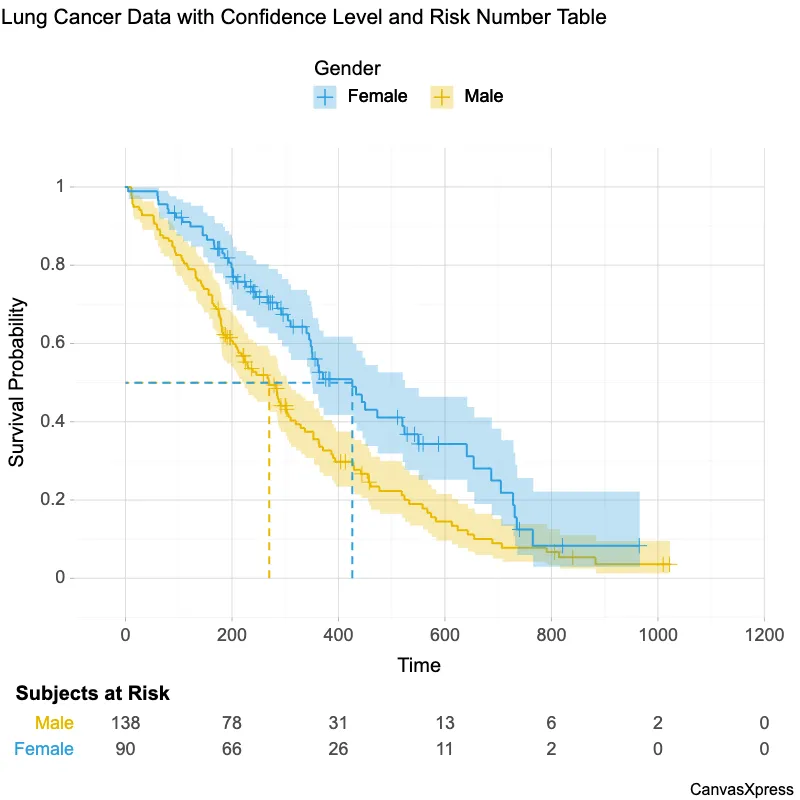
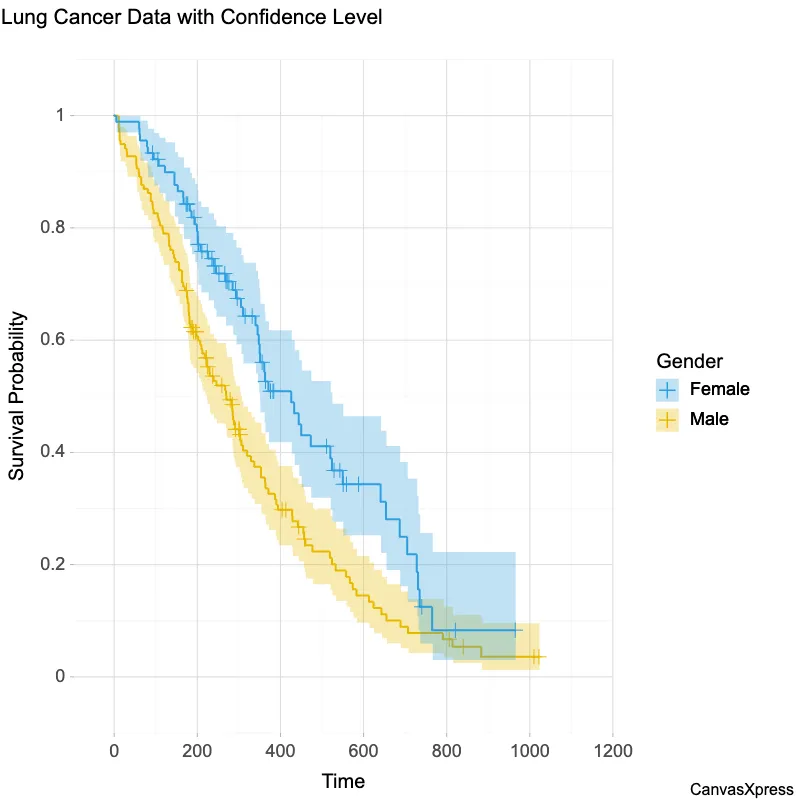
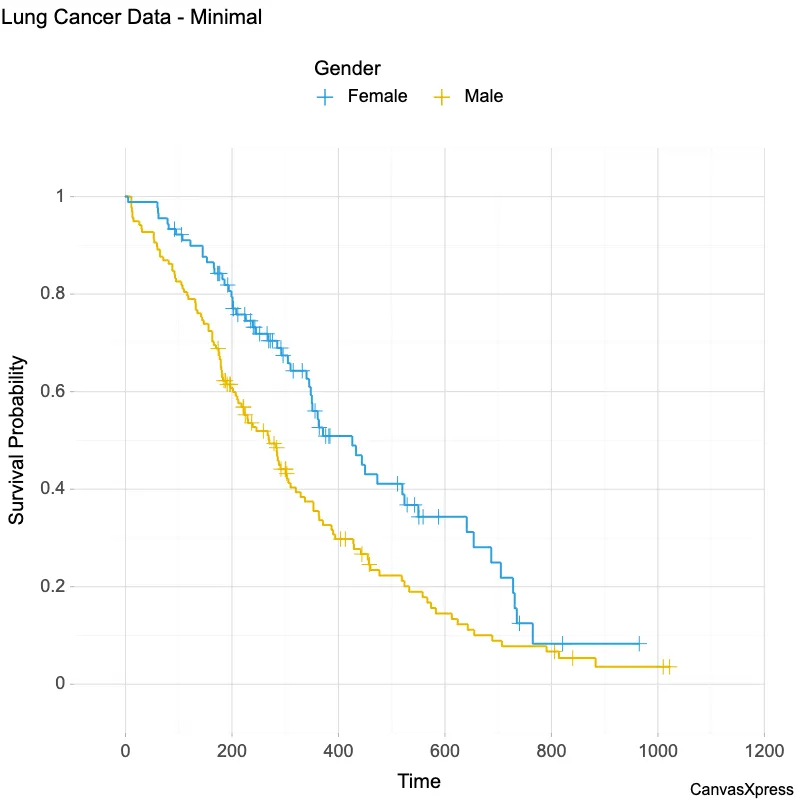
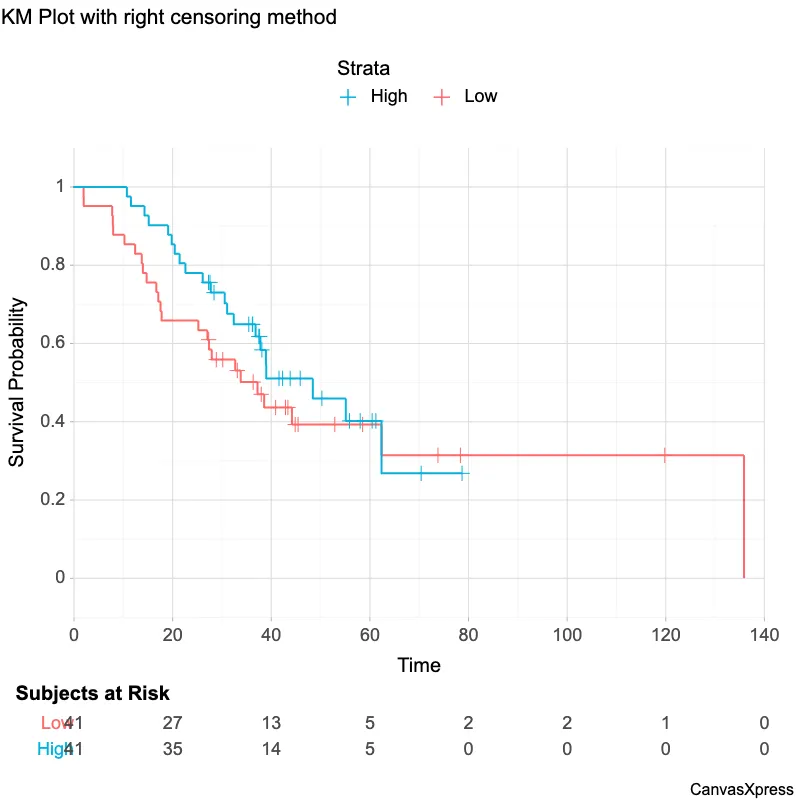
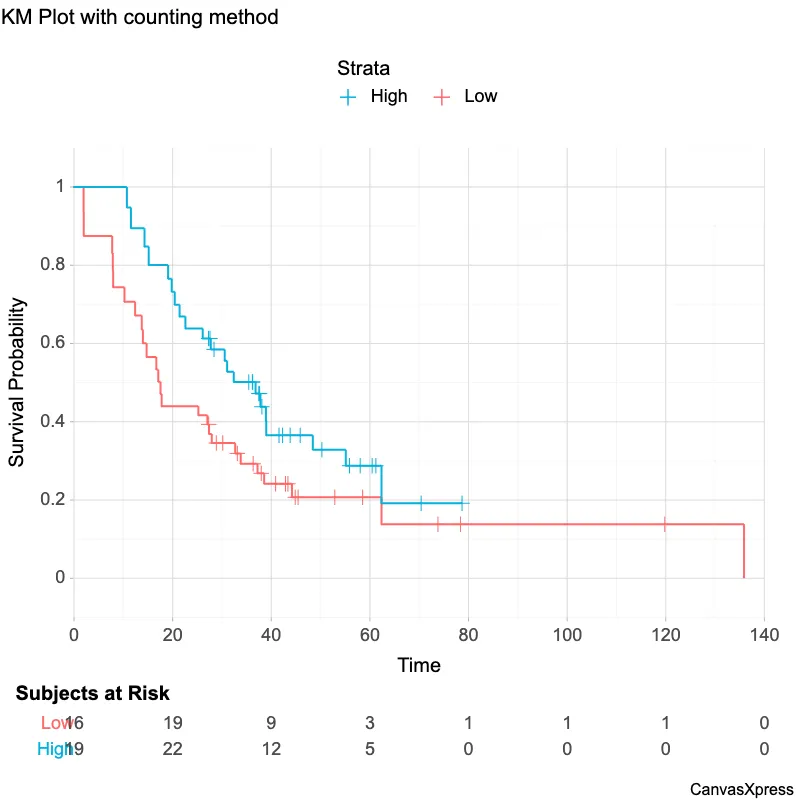
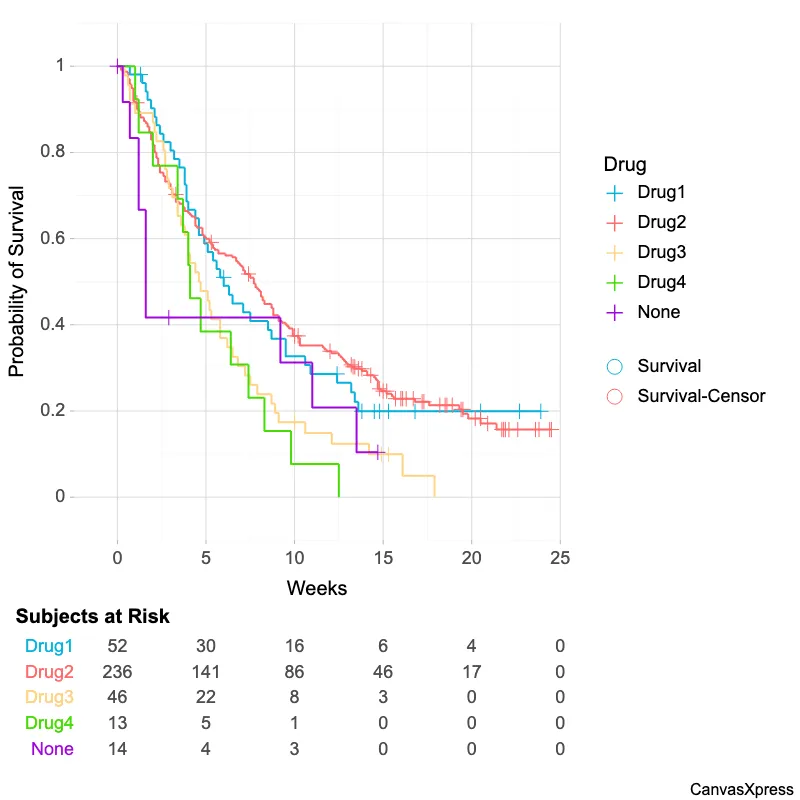
Kaplan-Meier graphs are visual representations of survival data, commonly used in medical research and other fields dealing with time-to-event data. They illustrate the probability of an event (like death or disease recurrence) occurring over time, providing a clear picture of survival rates within a group. These graphs display survival curves, where the y-axis shows the proportion of subjects who survived past a certain point in time, and the x-axis represents time. Steps or drops in the curve indicate the occurrence of events. Kaplan-Meier curves are essential tools for comparing survival experiences between different groups, such as patients receiving various treatments or possessing different characteristics.
<html>

  <head>
    <!-- Include the CanvasXpress library in your HTML file -->
    <link rel="stylesheet" href="https://www.canvasxpress.org/dist/canvasXpress.css" type="text/css"/>
    <script src="https://www.canvasxpress.org/dist/canvasXpress.min.js"></script>
  </head>

  <body>

    <!-- Create a canvas element for the chart with the desired dimensions -->
    <div>
      <canvas id="canvasId" width="600" height="600"></canvas>
    </div>


    <!-- Create a script to initialize the chart -->
    <script>

      // Use a data frame (2D-array) for the graph
      var data = [
        [ "Id", "Time", "Event", "Time2", "Strata"],
        [ "1", 52.8852459, 0, 22.49080328, "Low"],
        [ "2", 58.52459016, 0, 34.6547377, "Low"],
        [ "3", 7.868852459, 1, 6.06457377, "Low"],
        [ "4", 33.1147541, 0, 0.949819672, "Low"],
        [ "5", 28.85245902, 0, 1.048180328, "Low"],
        [ "6", 25.21311475, 1, 9.769491803, "Low"],
        [ "7", 40.8852459, 0, 0.261295082, "Low"],
        [ "8", 1.967213115, 1, 0, "Low"],
        [ "9", 10.2295082, 1, 0.031786885, "Low"],
        [ "10", 62.36065574, 1, 41.1137541, "Low"],
        [ "11", 78.36065574, 0, 33.1137541, "Low"],
        [ "12", 27.37704918, 1, 0, "Low"],
        [ "13", 27.31147541, 0, 0, "Low"],
        [ "14", 12.39344262, 1, 0, "Low"],
        [ "15", 38.55737705, 1, 18.78588525, "Low"],
        [ "16", 37.96721311, 0, 0.62195082, "Low"],
        [ "17", 13.96721311, 1, 8.556377049, "Low"],
        [ "18", 44.85245902, 0, 0.818672131, "Low"],
        [ "19", 119.8032787, 0, 85.53998361, "Low"],
        [ "20", 43.37704918, 0, 19.67113115, "Low"],
        [ "21", 7.737704918, 1, 3.999, "Low"],
        [ "22", 14.72131148, 1, 8.326868852, "Low"],
        [ "23", 32.68852459, 1, 0, "Low"],
        [ "24", 7.93442623, 1, 5.507196721, "Low"],
        [ "25", 33.80327869, 1, 27.60555738, "Low"],
        [ "26", 27.93442623, 1, 15.27768852, "Low"],
        [ "27", 135.8688525, 1, 134.3924426, "Low"],
        [ "28", 17.7704918, 1, 3.080967213, "Low"],
        // ... (data truncated after 29 records for clarity)
      ]

      // Create the configuration for the graph
      var config = {
         "colorBy" : "Strata",
         "graphType" : "Scatter2D",
         "kmRiskTable" : true,
         "kmTime" : "Time2",
         "legendColumns" : 2,
         "legendPosition" : "top",
         "showKMConfidenceIntervals" : false,
         "title" : "KM Plot with counting method",
         "xAxis" : ["Time"],
         "xAxisTitle" : "Time",
         "yAxis" : ["Event"],
         "yAxisTitle" : "Survival Probability"
      }

      // Event used to create graph (optional)
      var events = false


      // Call the CanvasXpress function to create the graph
      var cX = new CanvasXpress("canvasId", data, config, events);

      // Functions after rendering graph
      cX.addKMPlot();

    </script>

  </body>

</html>
<html>

  <head>
    <!-- Include the CanvasXpress library in your HTML file -->
    <link rel="stylesheet" href="https://www.canvasxpress.org/dist/canvasXpress.css" type="text/css"/>
    <script src="https://www.canvasxpress.org/dist/canvasXpress.min.js"></script>
  </head>

  <body>

    <!-- Create a canvas element for the chart with the desired dimensions -->
    <div>
      <canvas id="canvasId" width="600" height="600"></canvas>
    </div>


    <!-- Create a script to initialize the chart -->
    <script>

      // Create the data for the graph
      var data = {
         "y" : {
            "data" : [
              [52.8852459,0,22.49080328],
              [58.52459016,0,34.6547377],
              [7.868852459,1,6.06457377],
              [33.1147541,0,0.949819672],
              [28.85245902,0,1.048180328],
              [25.21311475,1,9.769491803],
              [40.8852459,0,0.261295082],
              [1.967213115,1,0],
              [10.2295082,1,0.031786885],
              [62.36065574,1,41.1137541],
              [78.36065574,0,33.1137541],
              [27.37704918,1,0],
              [27.31147541,0,0],
              [12.39344262,1,0],
              [38.55737705,1,18.78588525],
              [37.96721311,0,0.62195082],
              [13.96721311,1,8.556377049],
              [44.85245902,0,0.818672131],
              [119.8032787,0,85.53998361],
              [43.37704918,0,19.67113115],
              [7.737704918,1,3.999],
              [14.72131148,1,8.326868852],
              [32.68852459,1,0],
              [7.93442623,1,5.507196721],
              [33.80327869,1,27.60555738],
              [27.93442623,1,15.27768852],
              [135.8688525,1,134.3924426],
              [17.7704918,1,3.080967213],
              [45.44262295,0,19.44162295],
              [16.68852459,1,11.14654098],
              [17.08196721,1,0.195721311],
              [36.32786885,0,0],
              [13.73770492,1,4.785885246],
              [37.21311475,1,34.29408197],
              [17.54098361,1,0],
              [44.19672131,1,24.19572131],
              [73.80327869,0,49.47440984],
              [27.04918033,1,16.55637705],
              [1.93442623,1,0.589163934],
              [42.8852459,0,4.162934426],
              [30.16393443,0,0],
              [11.54098361,1,0.162934426],
              [26.09836066,1,21.04818033],
              [10.72131148,1,9.474409836],
              [42.29508197,0,4.195721311],
              [62.36065574,1,39.70391803],
              [37.47540984,0,0.490803279],
              [28.39344262,0,0],
              [48.42622951,1,40.68752459],
              [32.39344262,1,25.01539344],
              [78.68852459,0,47.67113115],
              [14.29508197,1,7.212114754],
              [36.16393443,0,0.06457377],
              [19.08196721,1,1.31047541],
              [27.27868852,0,0.097360656],
              [41.57377049,0,0.392442623],
              [37.63934426,0,4.359655738],
              [15.14754098,1,11.7694918],
              [61.21311475,0,33.70391803],
              [31.04918033,1,20.98260656],
              [20.42622951,1,15.17932787],
              [50.26229508,0,17.47440984],
              [30.55737705,1,0],
              [22.59016393,1,1.31047541],
              [38.91803279,1,15.37604918],
              [19.80327869,1,17.27768852],
              [37.80327869,1,18.19572131],
              [38.09836066,0,12.26129508],
              [27.57377049,0,3.638344262],
              [36.2295082,0,0],
              [36.81967213,1,32.39244262],
              [55.86885246,0,24.39244262],
              [43.83606557,0,19.37604918],
              [45.86885246,0,7.671131148],
              [27.73770492,1,23.63834426],
              [55.1147541,1,25.57277049],
              [35.44262295,0,4.62195082],
              [21.40983607,1,0],
              [58.03278689,0,17.1137541],
              [38.98360656,1,0],
              [70.39344262,0,46.58916393],
              [60.45901639,0,30.62195082]
            ],
            "smps" : ["Time","Event","Time2"],
            "vars" : ["1","2","3","4","5","6","7","8","9","10","11","12","13","14","15","16","17","18","19","20","21","22","23","24","25","26","27","28","29","30","31","32","33","34","35","36","37","38","39","40","41","42","43","44","45","46","47","48","49","50","51","52","53","54","55","56","57","58","59","60","61","62","63","64","65","66","67","68","69","70","71","72","73","74","75","76","77","78","79","80","81","82"]
         },
         "z" : {
            "Strata" : ["Low","Low","Low","Low","Low","Low","Low","Low","Low","Low","Low","Low","Low","Low","Low","Low","Low","Low","Low","Low","Low","Low","Low","Low","Low","Low","Low","Low","Low","Low","Low","Low","Low","Low","Low","Low","Low","Low","Low","Low","Low","High","High","High","High","High","High","High","High","High","High","High","High","High","High","High","High","High","High","High","High","High","High","High","High","High","High","High","High","High","High","High","High","High","High","High","High","High","High","High","High","High"]
         }
      }

      // Create the configuration for the graph
      var config = {
         "colorBy" : "Strata",
         "graphType" : "Scatter2D",
         "kmRiskTable" : true,
         "kmTime" : "Time2",
         "legendColumns" : 2,
         "legendPosition" : "top",
         "showKMConfidenceIntervals" : false,
         "title" : "KM Plot with counting method",
         "xAxis" : ["Time"],
         "xAxisTitle" : "Time",
         "yAxis" : ["Event"],
         "yAxisTitle" : "Survival Probability"
      }

      // Event used to create graph (optional)
      var events = false


      // Call the CanvasXpress function to create the graph
      var cX = new CanvasXpress("canvasId", data, config, events);

      // Functions after rendering graph
      cX.addKMPlot();

    </script>

  </body>

</html>
