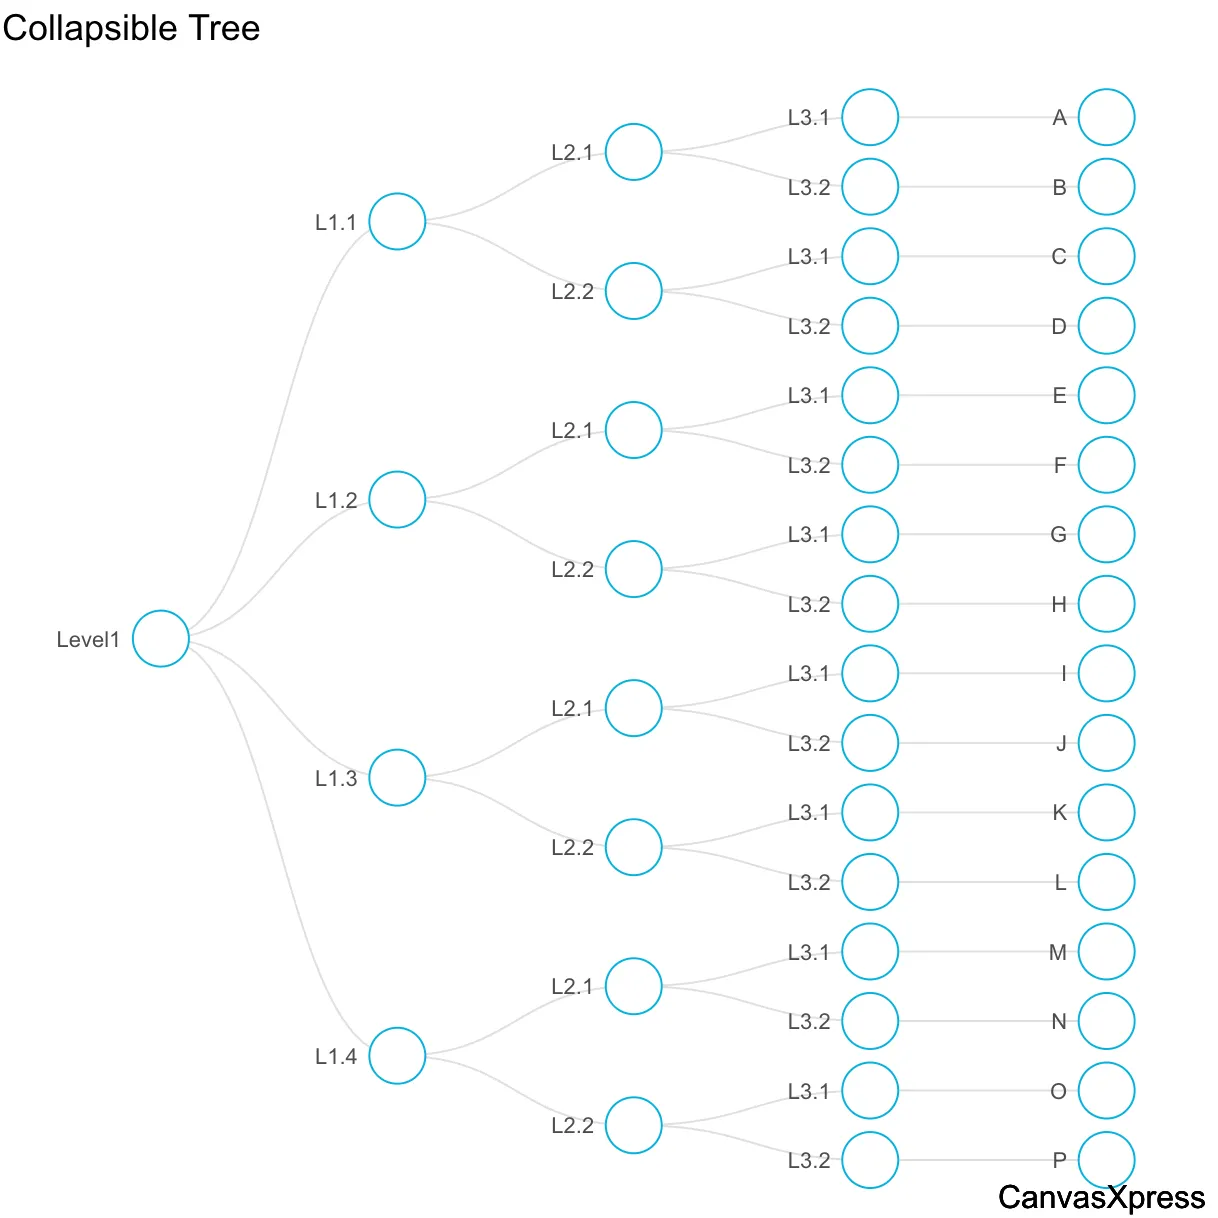
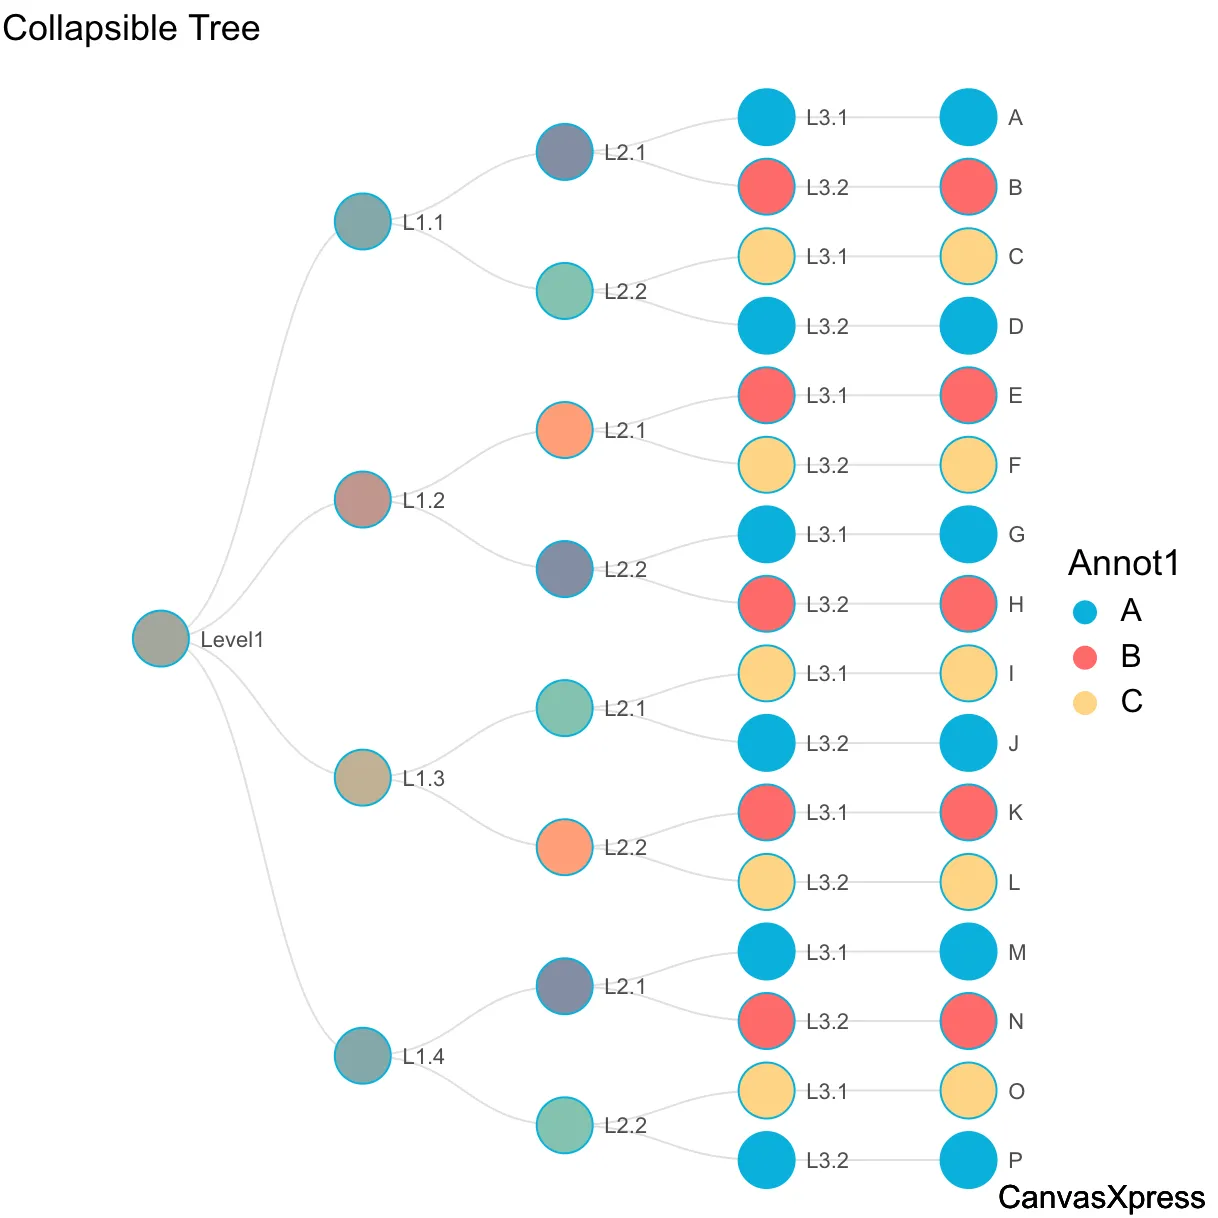
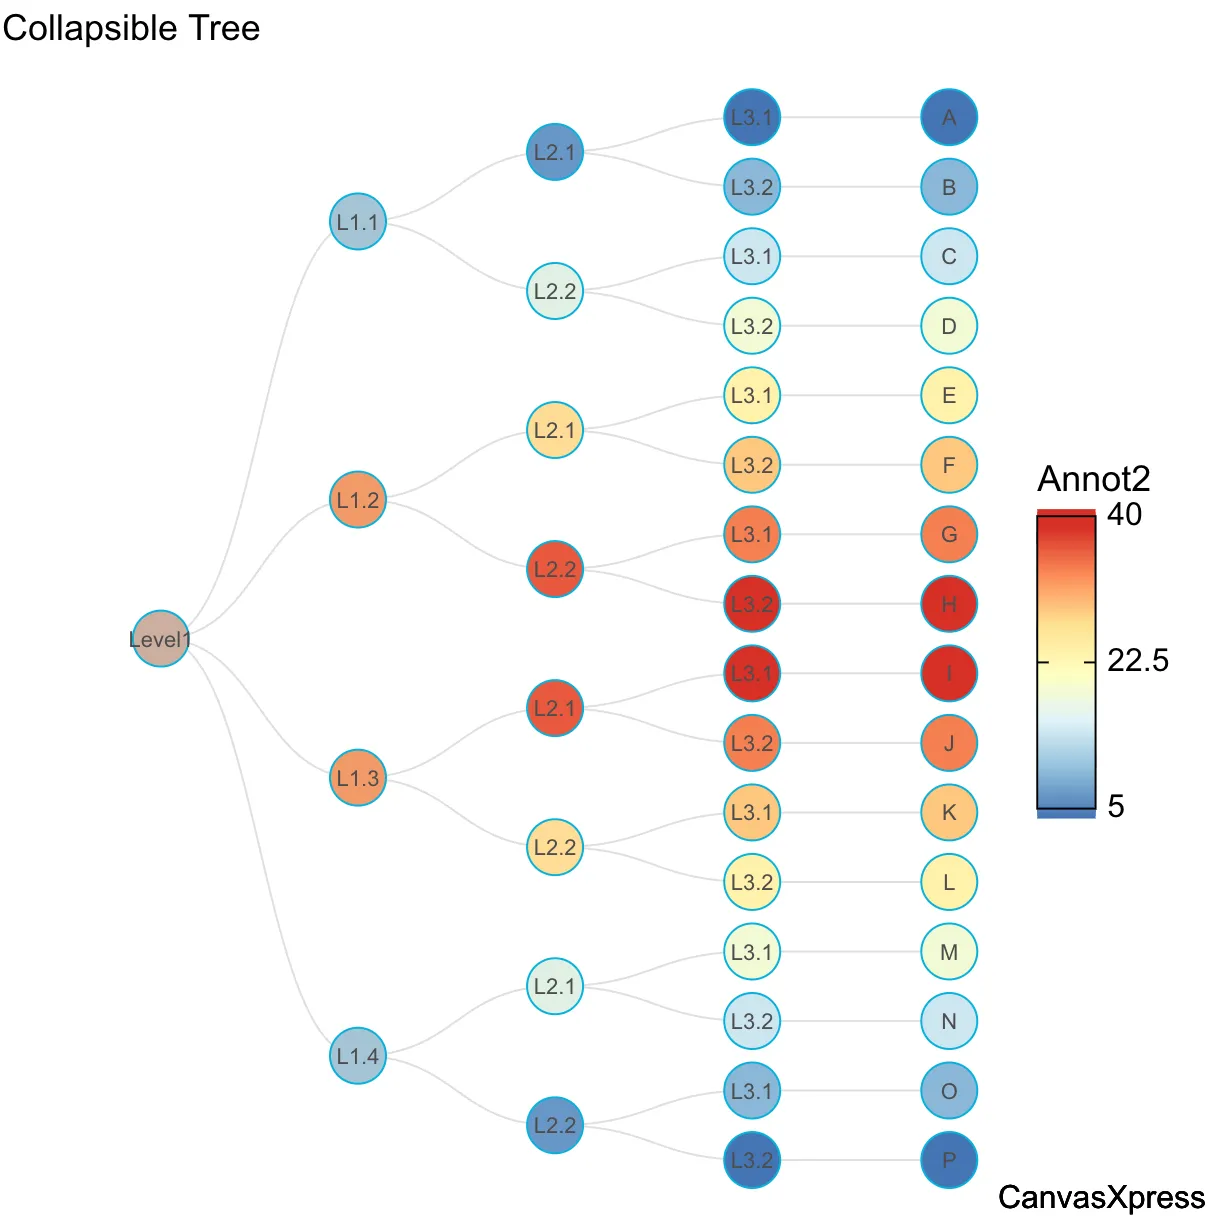
Efficient Tree Graphs for Data Hierarchy
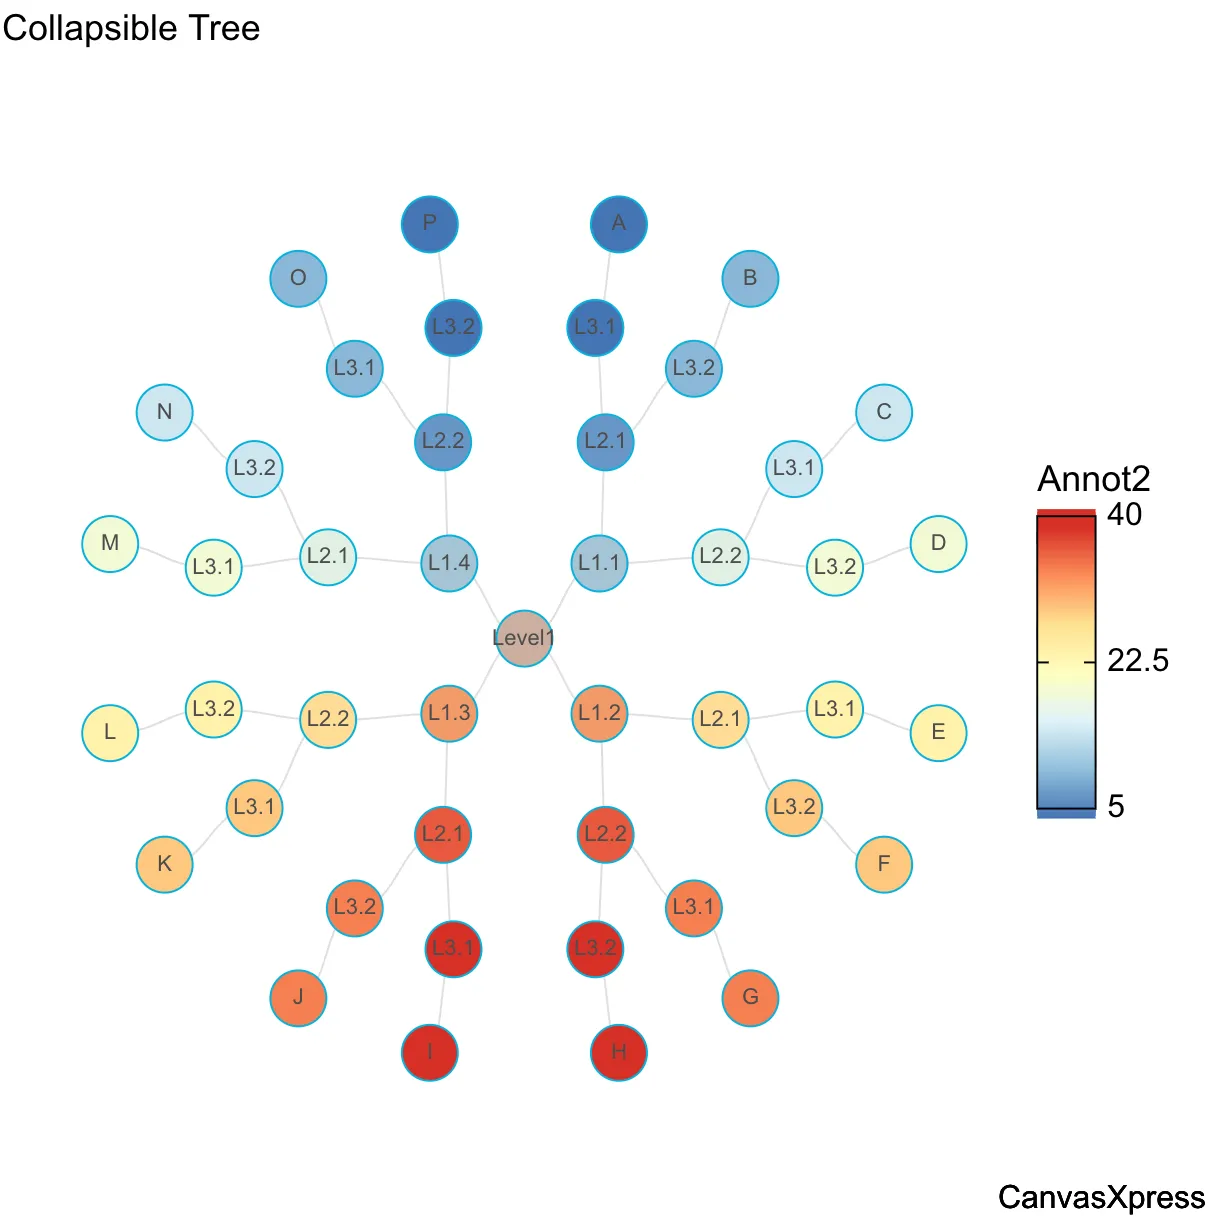
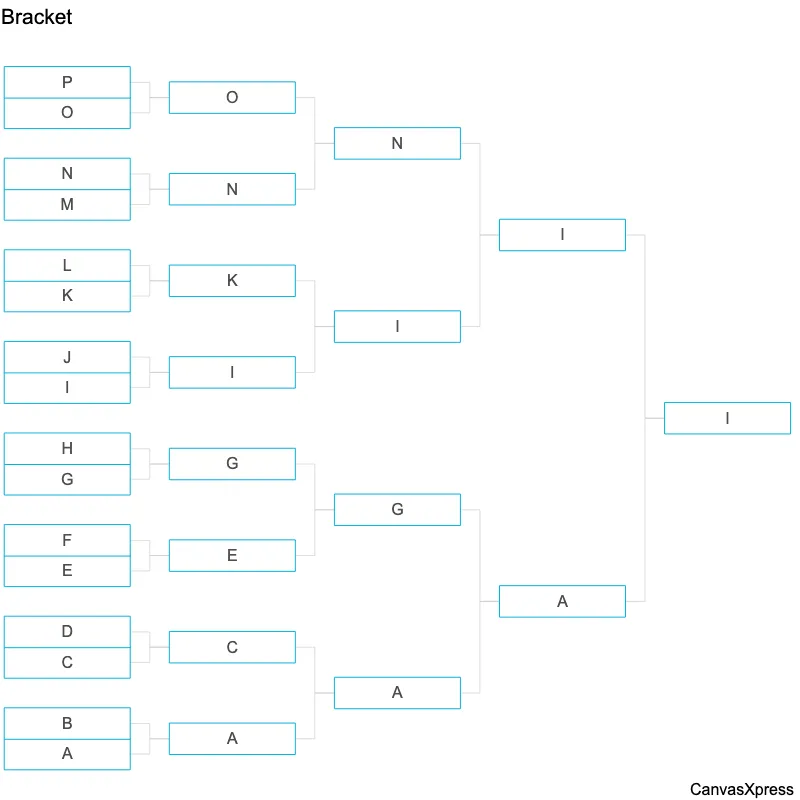
Tree graphs are hierarchical data structures, branching from a root node. Understanding tree graphs is crucial in computer science, with applications ranging from file systems to decision trees. Their structure allows efficient searching and sorting algorithms. Key concepts include nodes, edges, and the root node. Different tree types like binary trees and binary search trees offer varying levels of efficiency. Mastering tree graphs enhances problem-solving skills in various fields.
<html>

  <head>
    <!-- Include the CanvasXpress library in your HTML file -->
    <link rel="stylesheet" href="https://www.canvasxpress.org/dist/canvasXpress.css" type="text/css"/>
    <script src="https://www.canvasxpress.org/dist/canvasXpress.min.js"></script>
  </head>

  <body>

    <!-- Create a canvas element for the chart with the desired dimensions -->
    <div>
      <canvas id="canvasId" width="600" height="600"></canvas>
    </div>


    <!-- Create a script to initialize the chart -->
    <script>

      // Use a data frame (2D-array) for the graph
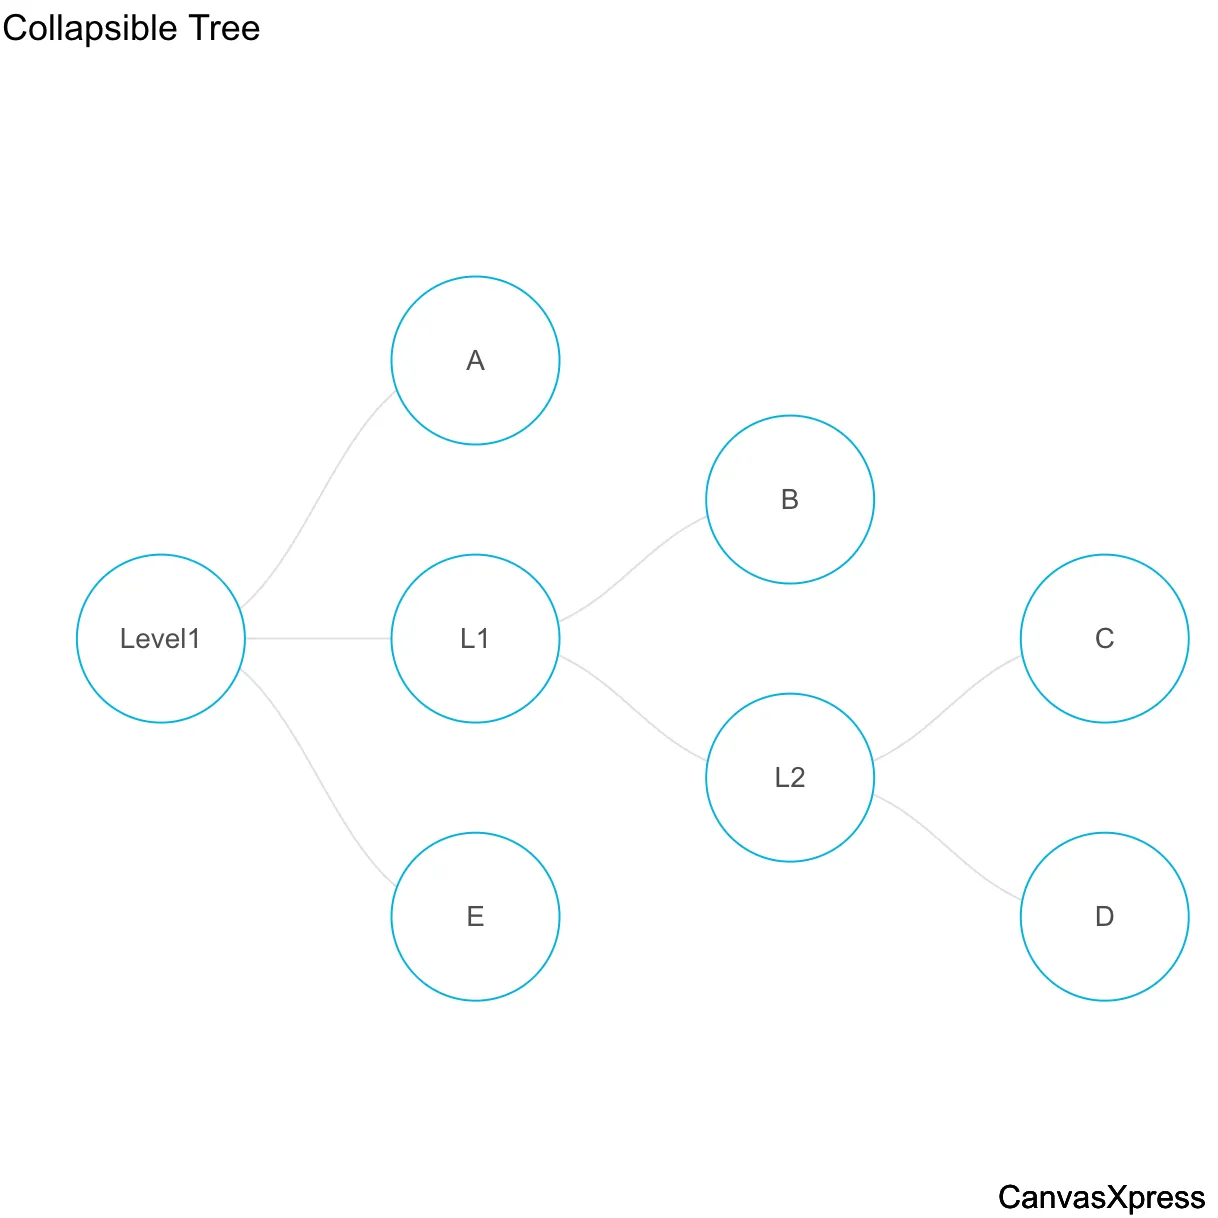
      var data = [
        [ "Id", "Order", "Level2", "Level1"],
        [ "A", 1, null, null],
        [ "B", 2, null, "L1"],
        [ "C", 3, "L2", "L1"],
        [ "D", 4, "L2", "L1"],
        [ "E", 5, null, null ]
      ];

      // Create the configuration for the graph
      var config = {
         "graphType" : "Tree",
         "hierarchy" : ["Level1","Level2"],
         "showTransition" : true,
         "title" : "Collapsible Tree",
         "xAxis": ["Order"]
      }

      // Event used to create graph (optional)
      var events = false


      // Call the CanvasXpress function to create the graph
      var cX = new CanvasXpress("canvasId", data, config, events);


    </script>

  </body>

</html>
<html>

  <head>
    <!-- Include the CanvasXpress library in your HTML file -->
    <link rel="stylesheet" href="https://www.canvasxpress.org/dist/canvasXpress.css" type="text/css"/>
    <script src="https://www.canvasxpress.org/dist/canvasXpress.min.js"></script>
  </head>

  <body>

    <!-- Create a canvas element for the chart with the desired dimensions -->
    <div>
      <canvas id="canvasId" width="600" height="600"></canvas>
    </div>


    <!-- Create a script to initialize the chart -->
    <script>

      // Create the data for the graph
      var data = {
         "x" : {
            "Level1" : [null,"L1","L1","L1",null],
            "Level2" : [null,null,"L2","L2",null]
         },
         "y" : {
            "data" : [
              [1,2,3,4,5]
            ],
            "smps" : ["A","B","C","D","E"],
            "vars" : ["Order"]
         }
      }

      // Create the configuration for the graph
      var config = {
         "graphType" : "Tree",
         "hierarchy" : ["Level1","Level2"],
         "showTransition" : true,
         "title" : "Collapsible Tree",
         "xAxis": ["Order"]
      }

      // Event used to create graph (optional)
      var events = false


      // Call the CanvasXpress function to create the graph
      var cX = new CanvasXpress("canvasId", data, config, events);


    </script>

  </body>

</html>
library(canvasXpress)
y=read.table("https://www.canvasxpress.org/data/r/cX-tree2-dat.txt", header=TRUE, sep="\t", quote="", row.names=1, fill=TRUE, check.names=FALSE, stringsAsFactors=FALSE)
x=read.table("https://www.canvasxpress.org/data/r/cX-tree2-smp.txt", header=TRUE, sep="\t", quote="", row.names=1, fill=TRUE, check.names=FALSE, stringsAsFactors=FALSE)
canvasXpress(
  data=y,
  smpAnnot=x,
  graphType="Tree",
  hierarchy=list("Level1", "Level2"),
  showTransition=TRUE,
  title="Collapsible Tree",
  xAxis=list("Order")
)
