Audrey Hepburn Awards Dot Plot
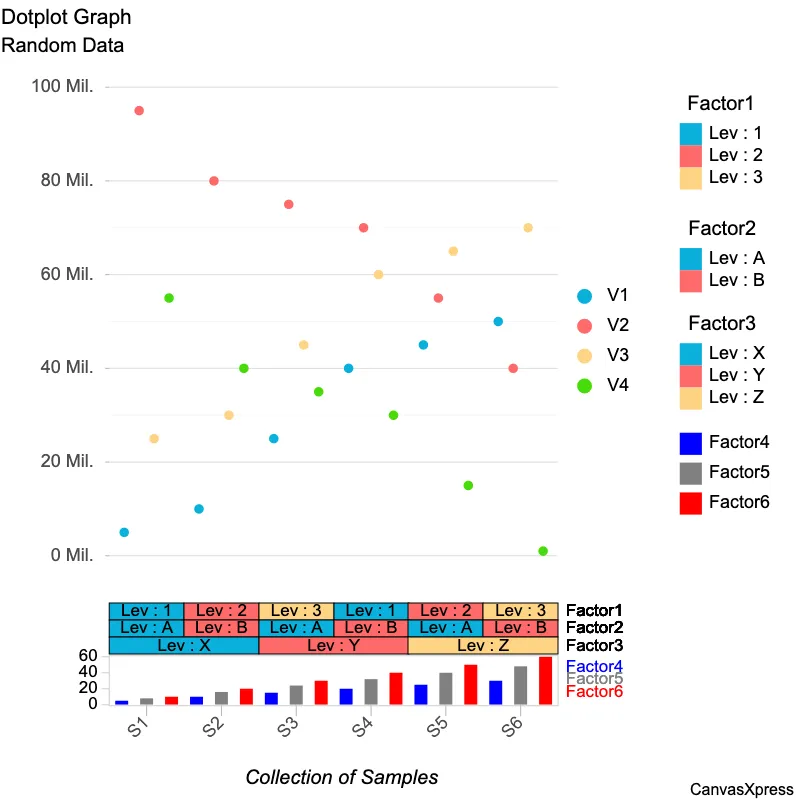
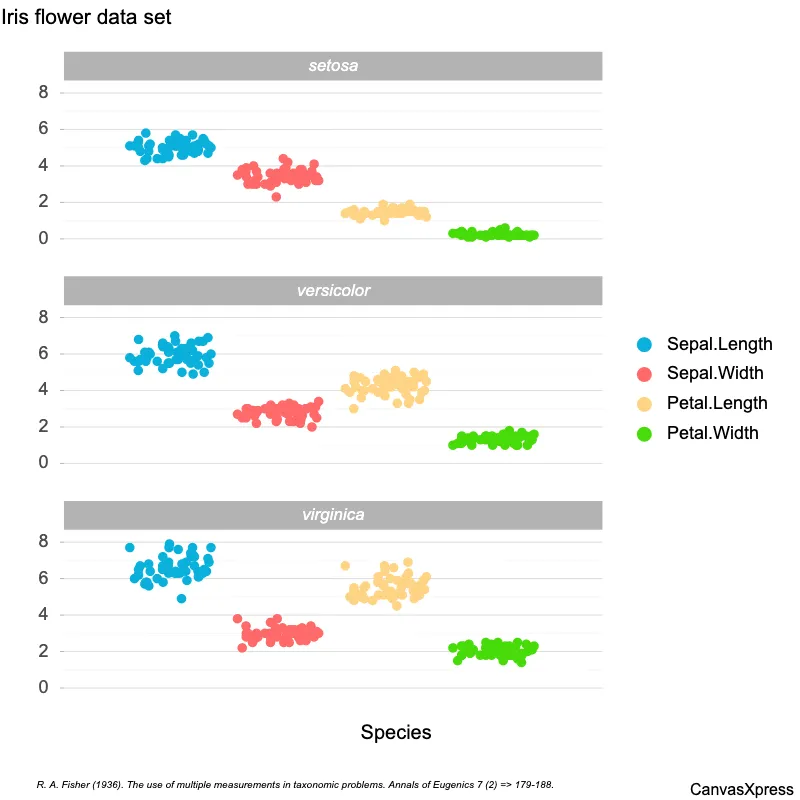
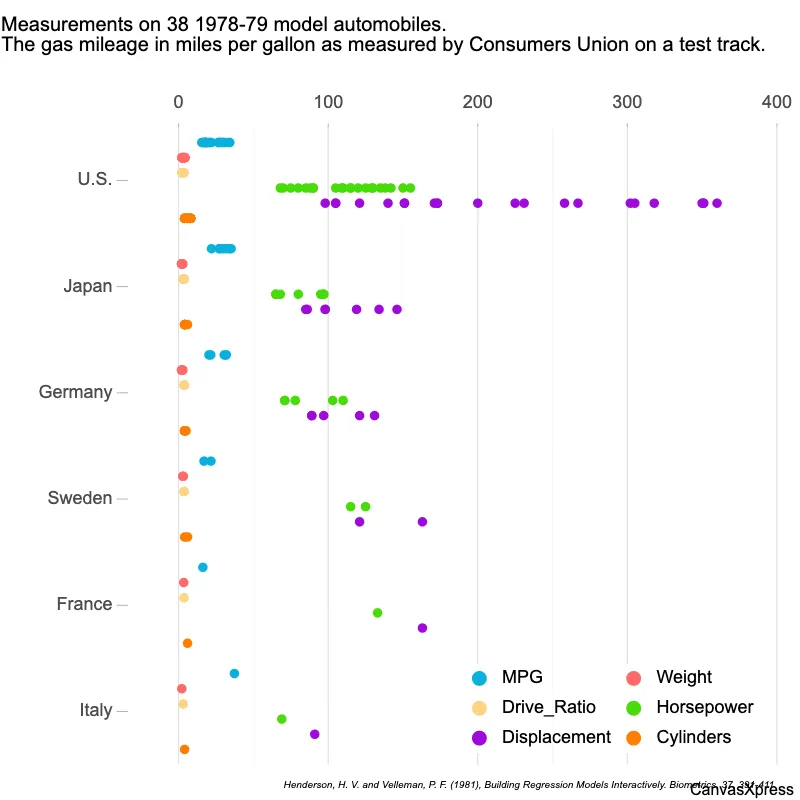
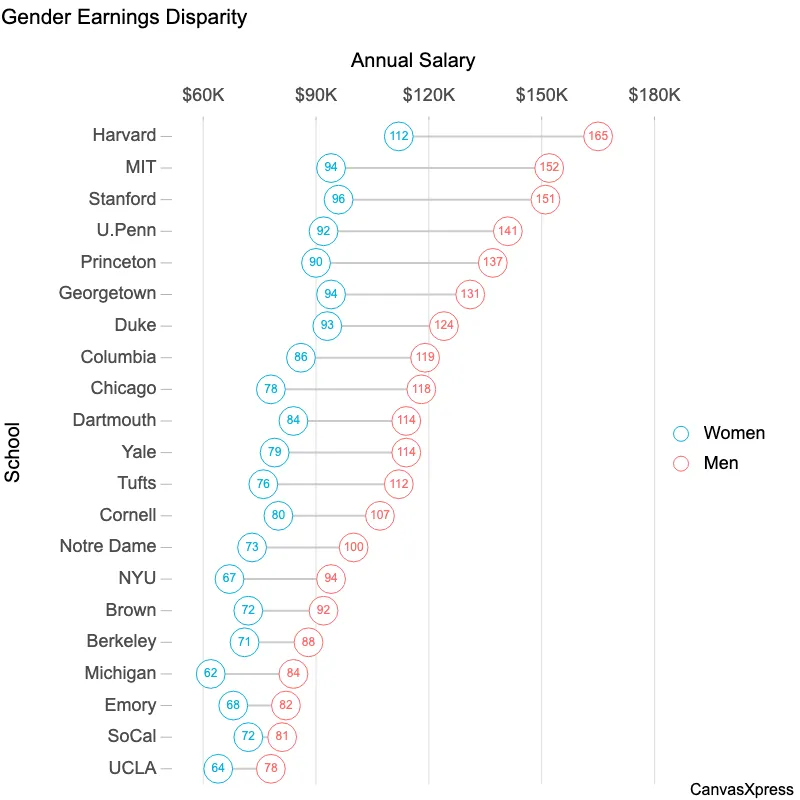
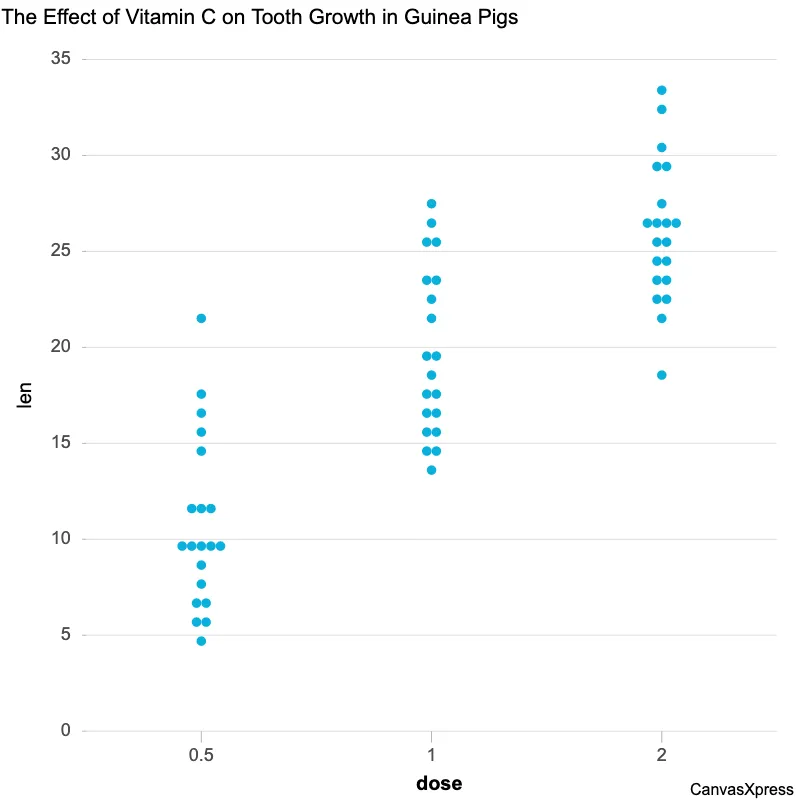
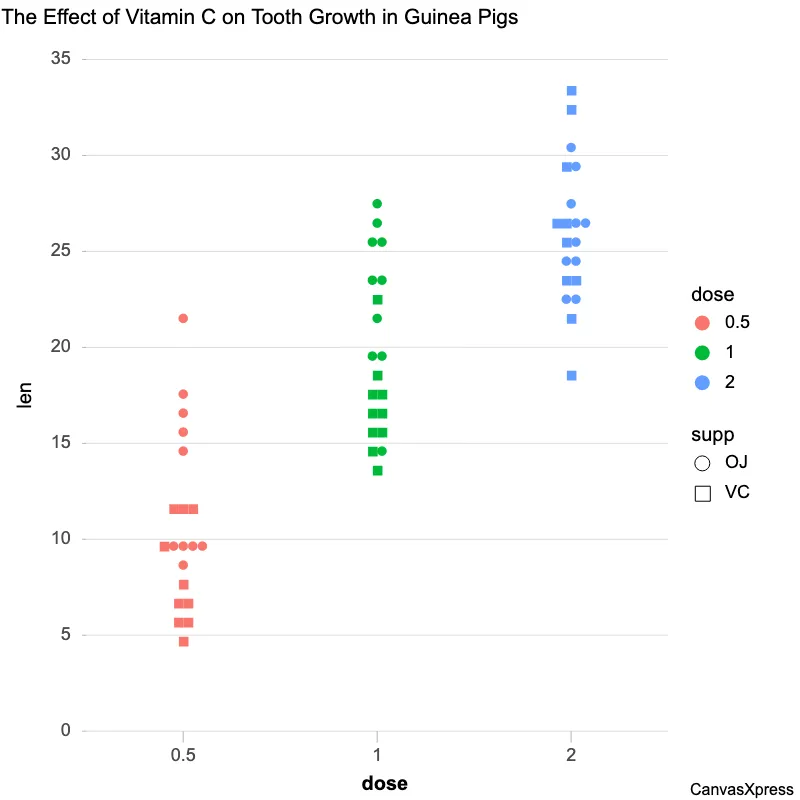
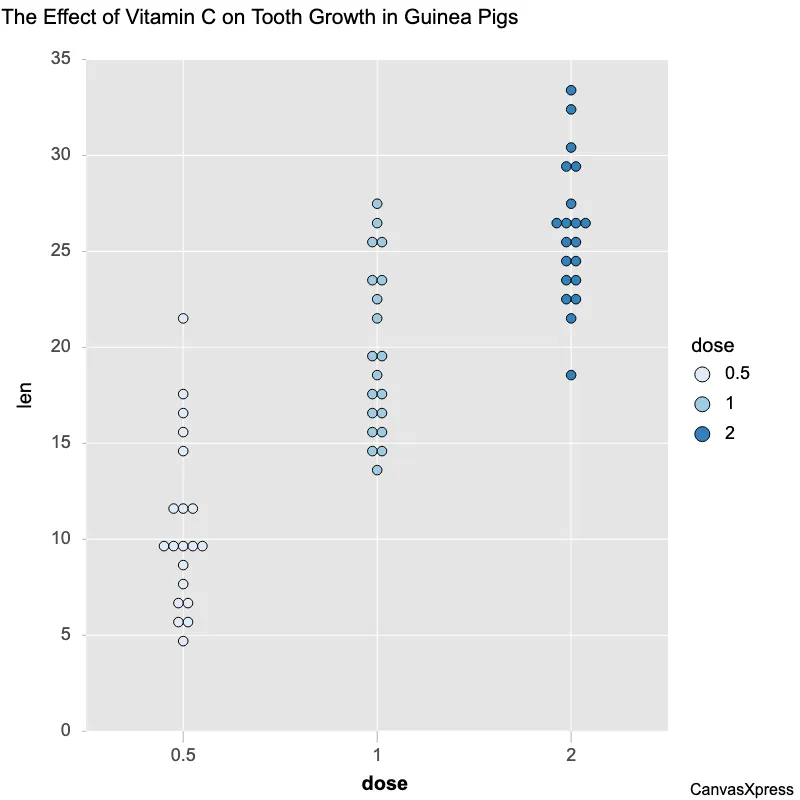
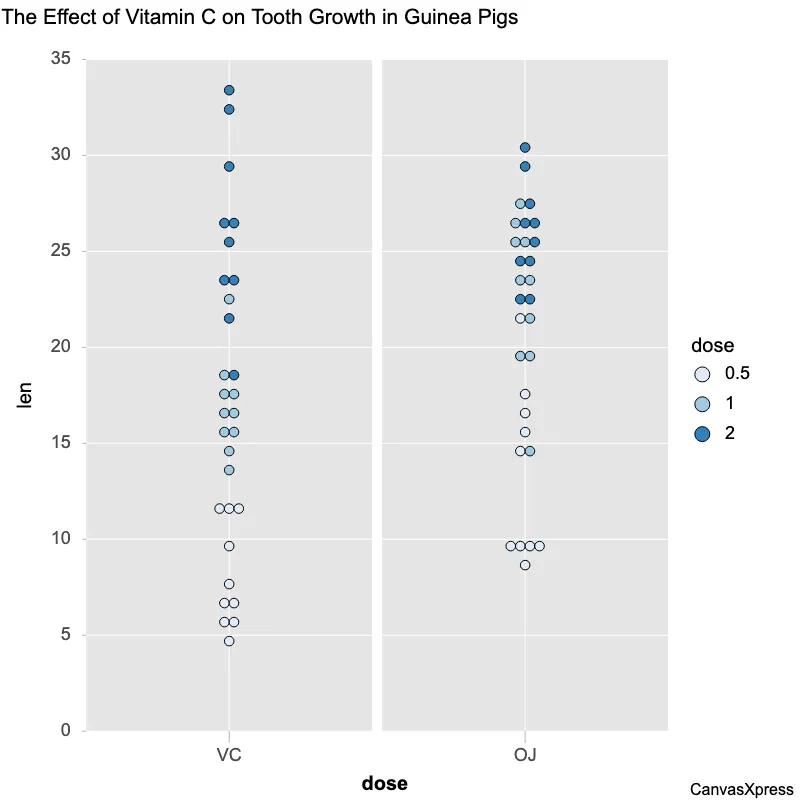
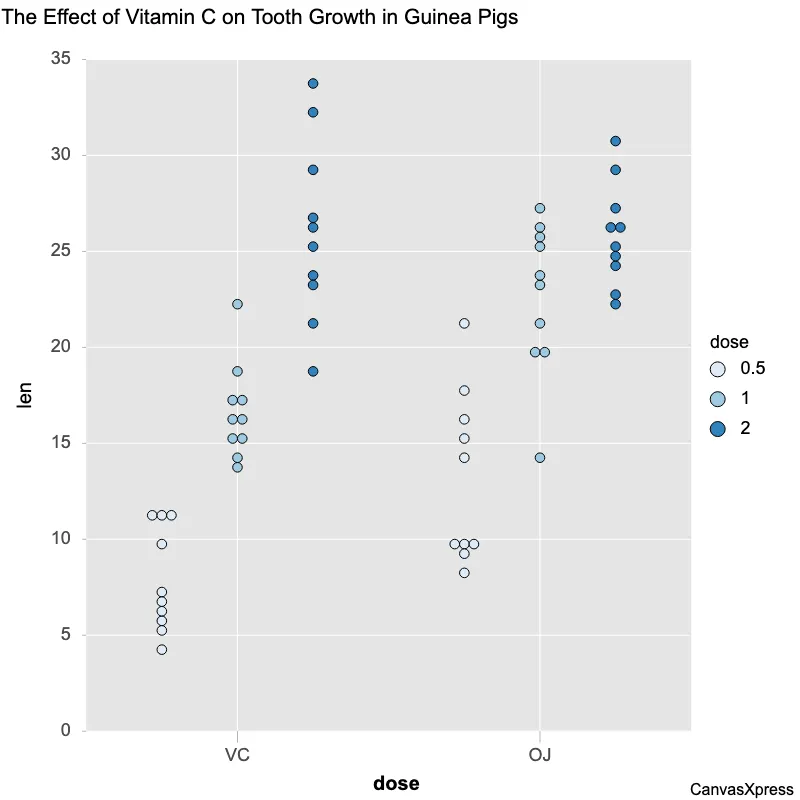
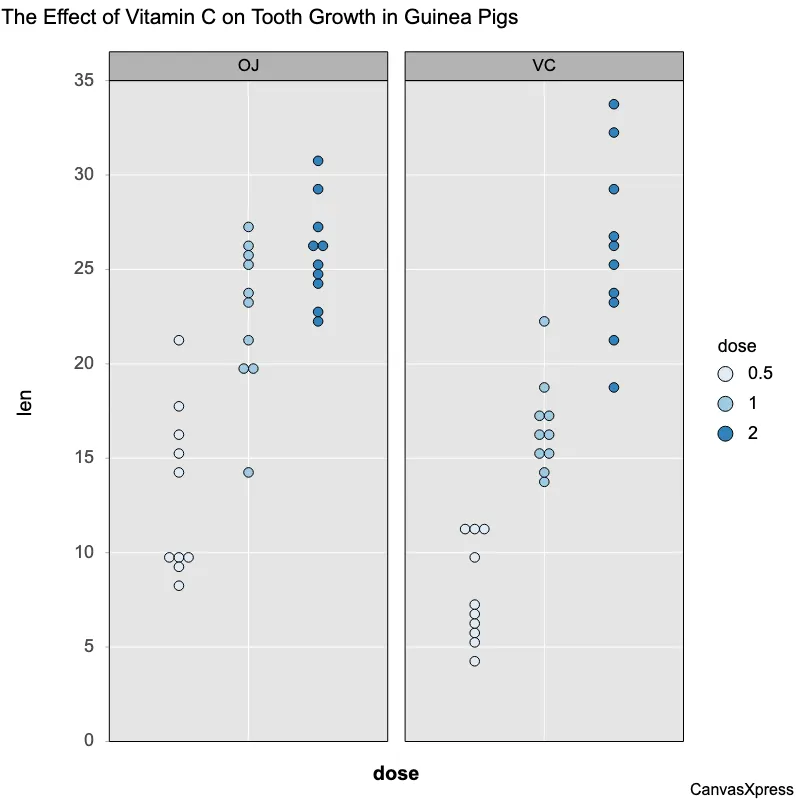
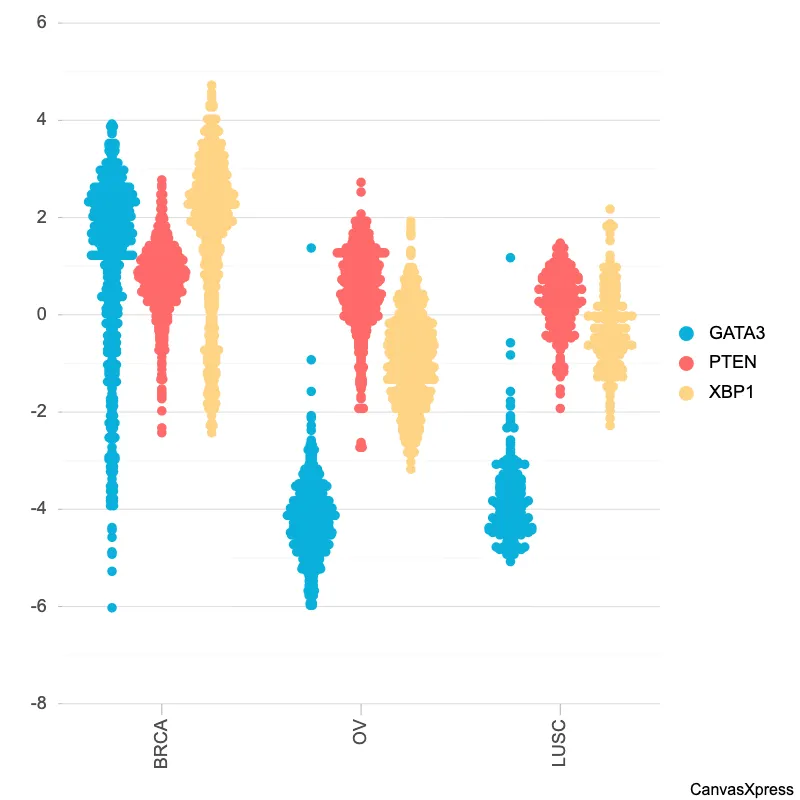
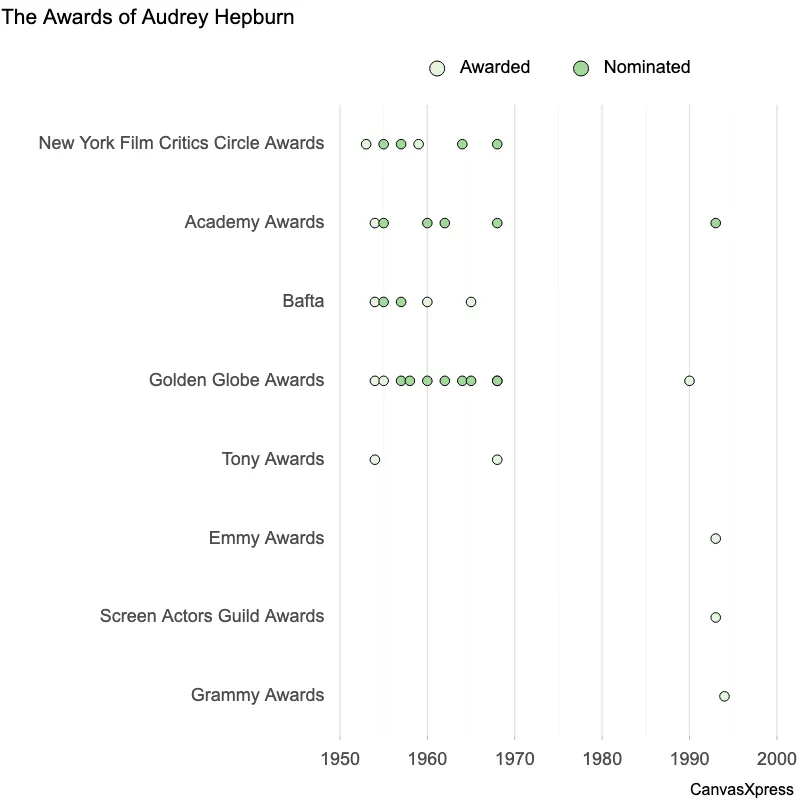
Dot plots are ideal for visualizing distributions, particularly when dealing with smaller datasets. They offer a clear and intuitive way to show the frequency of individual data points. This makes them useful for quickly identifying clusters, outliers, and the overall shape of the data. Compared to histograms, dot plots maintain the identity of each data point. This level of detail is beneficial when precise values are crucial and the sample size is not overwhelmingly large. They are easy to understand and interpret, making them a good choice for presentations and reports aimed at a broad audience.
<html>

  <head>
    <!-- Include the CanvasXpress library in your HTML file -->
    <link rel="stylesheet" href="https://www.canvasxpress.org/dist/canvasXpress.css" type="text/css"/>
    <script src="https://www.canvasxpress.org/dist/canvasXpress.min.js"></script>
  </head>

  <body>

    <!-- Create a canvas element for the chart with the desired dimensions -->
    <div>
      <canvas id="canvasId" width="600" height="600"></canvas>
    </div>


    <!-- Create a script to initialize the chart -->
    <script>

      // Use a data frame (2D-array) for the graph
      var data = [
        [ "Id", "Year", "Work", "Award", "Result"],
        [ "R1", 1953, "Roman Holiday", "New York Film Critics Circle Awards", "Awarded"],
        [ "R2", 1954, "Roman Holiday", "Academy Awards", "Awarded"],
        [ "R3", 1954, "Roman Holiday", "Bafta", "Awarded"],
        [ "R4", 1954, "Roman Holiday", "Golden Globe Awards", "Awarded"],
        [ "R5", 1954, "Ondine", "Tony Awards", "Awarded"],
        [ "R6", 1955, "Sabrina", "Academy Awards", "Nominated"],
        [ "R7", 1955, "Sabrina", "Bafta", "Nominated"],
        [ "R8", 1955, "Henrietta Award for World Film Favorite", "Golden Globe Awards", "Awarded"],
        [ "R9", 1955, "Sabrina", "New York Film Critics Circle Awards", "Nominated"],
        [ "R10", 1957, "War and Peace", "Bafta", "Nominated"],
        [ "R11", 1957, "War and Peace", "Golden Globe Awards", "Nominated"],
        [ "R12", 1957, "Love in the Afternoon", "New York Film Critics Circle Awards", "Nominated"],
        [ "R13", 1958, "Love in the Afternoon", "Golden Globe Awards", "Nominated"],
        [ "R14", 1959, "The Nun's Story", "New York Film Critics Circle Awards", "Awarded"],
        [ "R15", 1960, "The Nun's Story", "Academy Awards", "Nominated"],
        [ "R16", 1960, "The Nun's Story", "Bafta", "Awarded"],
        [ "R17", 1960, "The Nun's Story", "Golden Globe Awards", "Nominated"],
        [ "R18", 1962, "Breakfast at Tiffany's", "Academy Awards", "Nominated"],
        [ "R19", 1962, "Breakfast at Tiffany's", "Golden Globe Awards", "Nominated"],
        [ "R20", 1964, "Charade", "Golden Globe Awards", "Nominated"],
        [ "R21", 1964, "My Fair Lady", "New York Film Critics Circle Awards", "Nominated"],
        [ "R22", 1965, "Charade", "Bafta", "Awarded"],
        [ "R23", 1965, "My Fair Lady", "Golden Globe Awards", "Nominated"],
        [ "R24", 1968, "Wait Until Dark", "Academy Awards", "Nominated"],
        [ "R25", 1968, "Two for the Road", "Golden Globe Awards", "Nominated"],
        [ "R26", 1968, "Wait Until Dark", "Golden Globe Awards", "Nominated"],
        [ "R27", 1968, "Wait Until Dark", "New York Film Critics Circle Awards", "Nominated"],
        [ "R28", 1968, "Special Tony Award", "Tony Awards", "Awarded"],
        // ... (data truncated after 29 records for clarity)
      ]

      // Create the configuration for the graph
      var config = {
         "colorBy" : "Result",
         "colorScheme" : "Greens",
         "graphType" : "Dotplot",
         "groupingFactors" : ["Award"],
         "jitter" : false,
         "legendColumns" : 2,
         "legendKeyBackgroundBorderColor" : "rgba(255,255,255,0)",
         "legendKeyBackgroundColor" : "rgba(255,255,255,0)",
         "legendPosition" : "top",
         "maxSmpStringLen" : 50,
         "objectBorderColor" : "rgba(0,0,0)",
         "showErrorBars" : false,
         "showLegendTitle" : false,
         "title" : "The Awards of Audrey Hepburn",
         "xAxis" : ["Year"],
         "xAxis2Show" : true,
         "xAxisShow" : false
      }

      // Event used to create graph (optional)
      var events = false


      // Call the CanvasXpress function to create the graph
      var cX = new CanvasXpress("canvasId", data, config, events);


    </script>

  </body>

</html>
<html>

  <head>
    <!-- Include the CanvasXpress library in your HTML file -->
    <link rel="stylesheet" href="https://www.canvasxpress.org/dist/canvasXpress.css" type="text/css"/>
    <script src="https://www.canvasxpress.org/dist/canvasXpress.min.js"></script>
  </head>

  <body>

    <!-- Create a canvas element for the chart with the desired dimensions -->
    <div>
      <canvas id="canvasId" width="600" height="600"></canvas>
    </div>


    <!-- Create a script to initialize the chart -->
    <script>

      // Create the data for the graph
      var data = {
         "x" : {
            "Award" : ["New York Film Critics Circle Awards","Academy Awards","Bafta","Golden Globe Awards","Tony Awards","Academy Awards","Bafta","Golden Globe Awards","New York Film Critics Circle Awards","Bafta","Golden Globe Awards","New York Film Critics Circle Awards","Golden Globe Awards","New York Film Critics Circle Awards","Academy Awards","Bafta","Golden Globe Awards","Academy Awards","Golden Globe Awards","Golden Globe Awards","New York Film Critics Circle Awards","Bafta","Golden Globe Awards","Academy Awards","Golden Globe Awards","Golden Globe Awards","New York Film Critics Circle Awards","Tony Awards","Golden Globe Awards","Academy Awards","Emmy Awards","Screen Actors Guild Awards","Grammy Awards"],
            "Result" : ["Awarded","Awarded","Awarded","Awarded","Awarded","Nominated","Nominated","Awarded","Nominated","Nominated","Nominated","Nominated","Nominated","Awarded","Nominated","Awarded","Nominated","Nominated","Nominated","Nominated","Nominated","Awarded","Nominated","Nominated","Nominated","Nominated","Nominated","Awarded","Awarded","Nominated","Awarded","Awarded","Awarded"],
            "Work" : ["Roman Holiday","Roman Holiday","Roman Holiday","Roman Holiday","Ondine","Sabrina","Sabrina","Henrietta Award for World Film Favorite","Sabrina","War and Peace","War and Peace","Love in the Afternoon","Love in the Afternoon","The Nun's Story","The Nun's Story","The Nun's Story","The Nun's Story","Breakfast at Tiffany's","Breakfast at Tiffany's","Charade","My Fair Lady","Charade","My Fair Lady","Wait Until Dark","Two for the Road","Wait Until Dark","Wait Until Dark","Special Tony Award","Cecil B. DeMille Award","Jean Hersholt Humanitarian Award","Gardens of the World with Audrey Hepburn","Life Achievement Award","Audrey Hepburn's Enchanted Tales"]
         },
         "y" : {
            "data" : [
              [1953,1954,1954,1954,1954,1955,1955,1955,1955,1957,1957,1957,1958,1959,1960,1960,1960,1962,1962,1964,1964,1965,1965,1968,1968,1968,1968,1968,1990,1993,1993,1993,1994]
            ],
            "smps" : ["R1","R2","R3","R4","R5","R6","R7","R8","R9","R10","R11","R12","R13","R14","R15","R16","R17","R18","R19","R20","R21","R22","R23","R24","R25","R26","R27","R28","R29","R30","R31","R32","R33"],
            "vars" : ["Year"]
         }
      }

      // Create the configuration for the graph
      var config = {
         "colorBy" : "Result",
         "colorScheme" : "Greens",
         "graphType" : "Dotplot",
         "groupingFactors" : ["Award"],
         "jitter" : false,
         "legendColumns" : 2,
         "legendKeyBackgroundBorderColor" : "rgba(255,255,255,0)",
         "legendKeyBackgroundColor" : "rgba(255,255,255,0)",
         "legendPosition" : "top",
         "maxSmpStringLen" : 50,
         "objectBorderColor" : "rgba(0,0,0)",
         "showErrorBars" : false,
         "showLegendTitle" : false,
         "title" : "The Awards of Audrey Hepburn",
         "xAxis" : ["Year"],
         "xAxis2Show" : true,
         "xAxisShow" : false
      }

      // Event used to create graph (optional)
      var events = false


      // Call the CanvasXpress function to create the graph
      var cX = new CanvasXpress("canvasId", data, config, events);


    </script>

  </body>

</html>
library(canvasXpress)
y=read.table("https://www.canvasxpress.org/data/r/cX-audrey2-dat.txt", header=TRUE, sep="\t", quote="", row.names=1, fill=TRUE, check.names=FALSE, stringsAsFactors=FALSE)
x=read.table("https://www.canvasxpress.org/data/r/cX-audrey2-smp.txt", header=TRUE, sep="\t", quote="", row.names=1, fill=TRUE, check.names=FALSE, stringsAsFactors=FALSE)
canvasXpress(
  data=y,
  smpAnnot=x,
  colorBy="Result",
  colorScheme="Greens",
  graphType="Dotplot",
  groupingFactors=list("Award"),
  jitter=FALSE,
  legendColumns=2,
  legendKeyBackgroundBorderColor="rgba(255,255,255,0)",
  legendKeyBackgroundColor="rgba(255,255,255,0)",
  legendPosition="top",
  maxSmpStringLen=50,
  objectBorderColor="rgba(0,0,0)",
  showErrorBars=FALSE,
  showLegendTitle=FALSE,
  title="The Awards of Audrey Hepburn",
  xAxis=list("Year"),
  xAxis2Show=TRUE,
  xAxisShow=FALSE
)
