Enhancing Data Clarity with Dot Plots
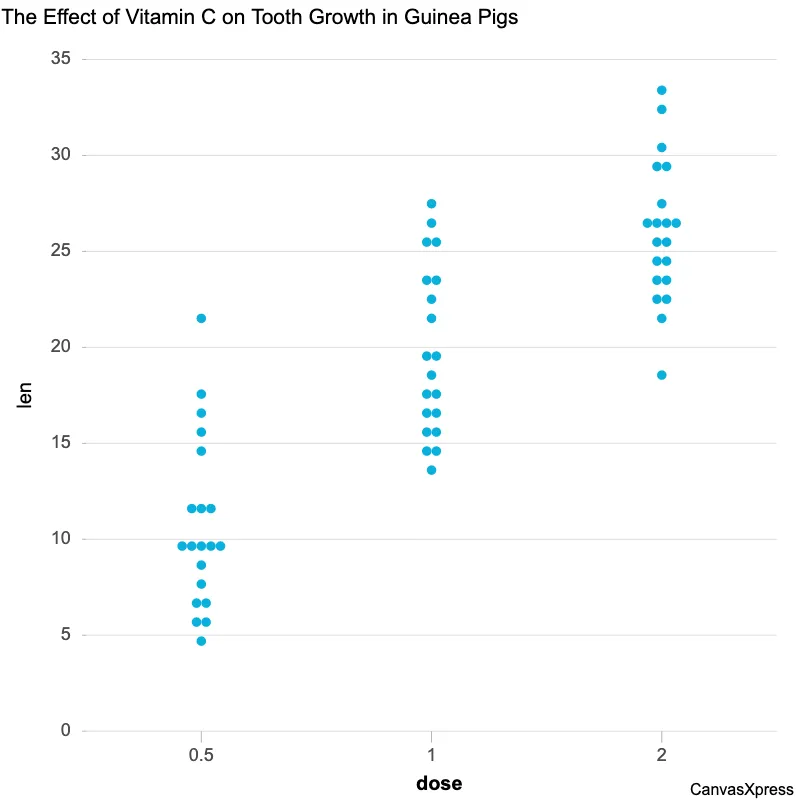
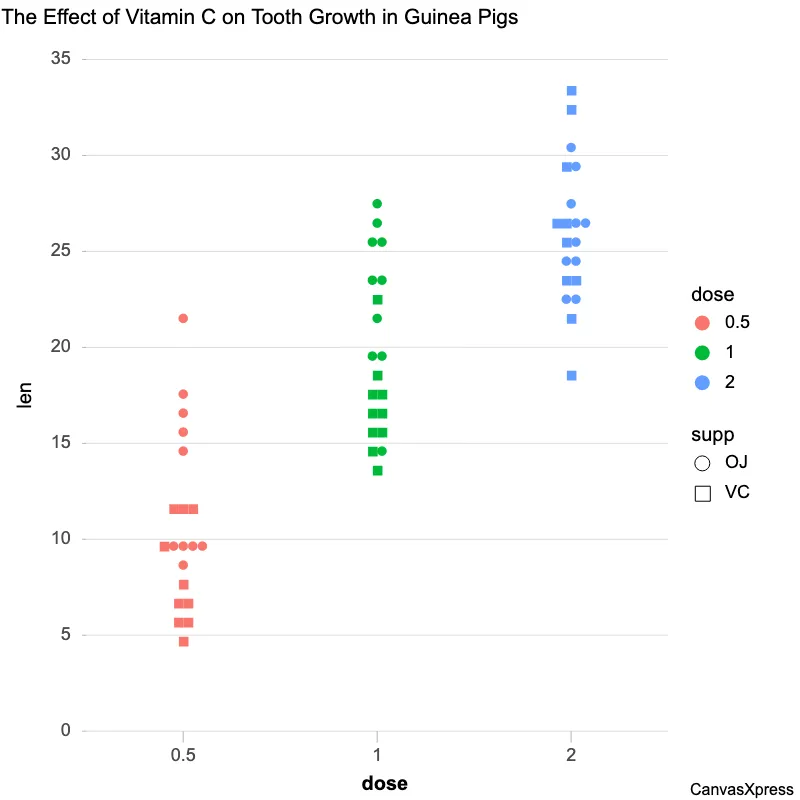
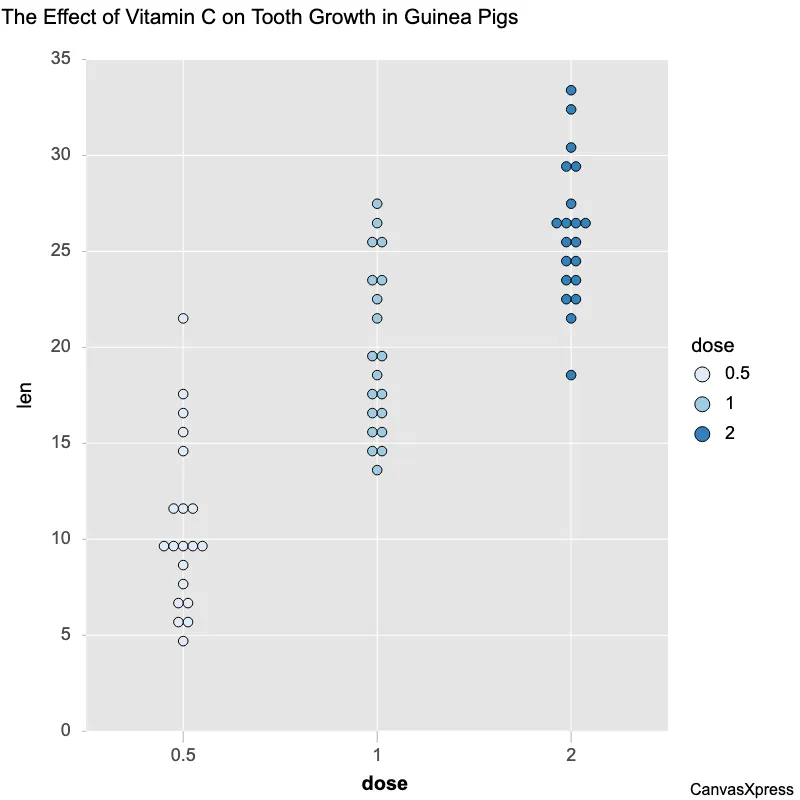
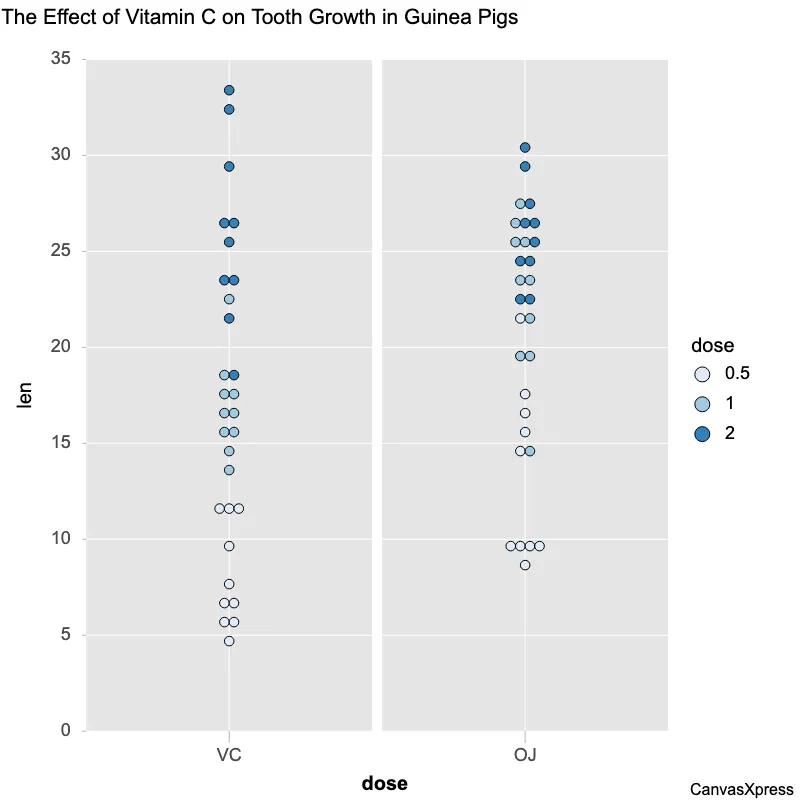
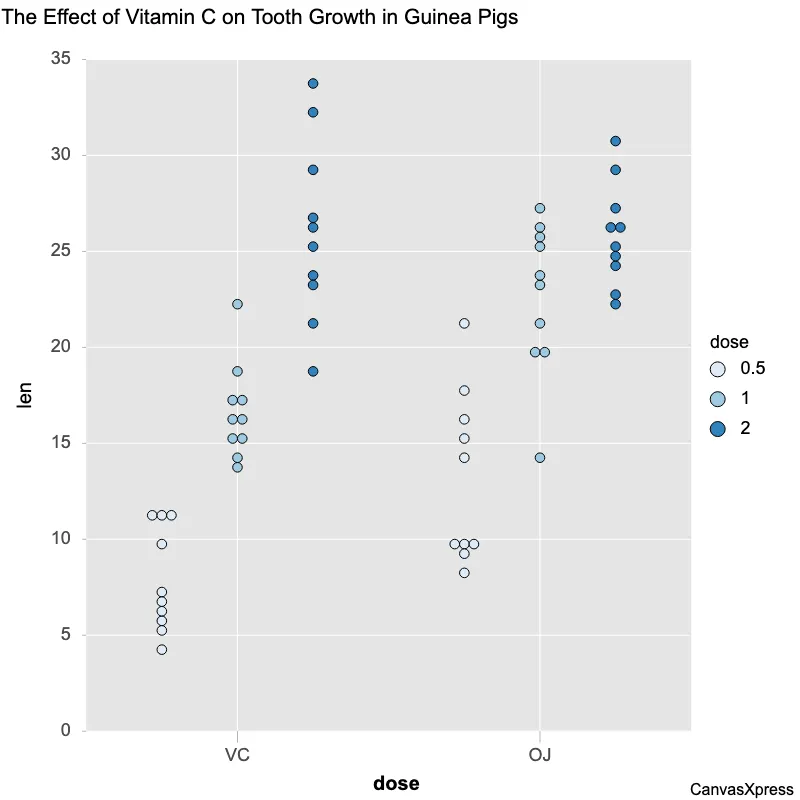
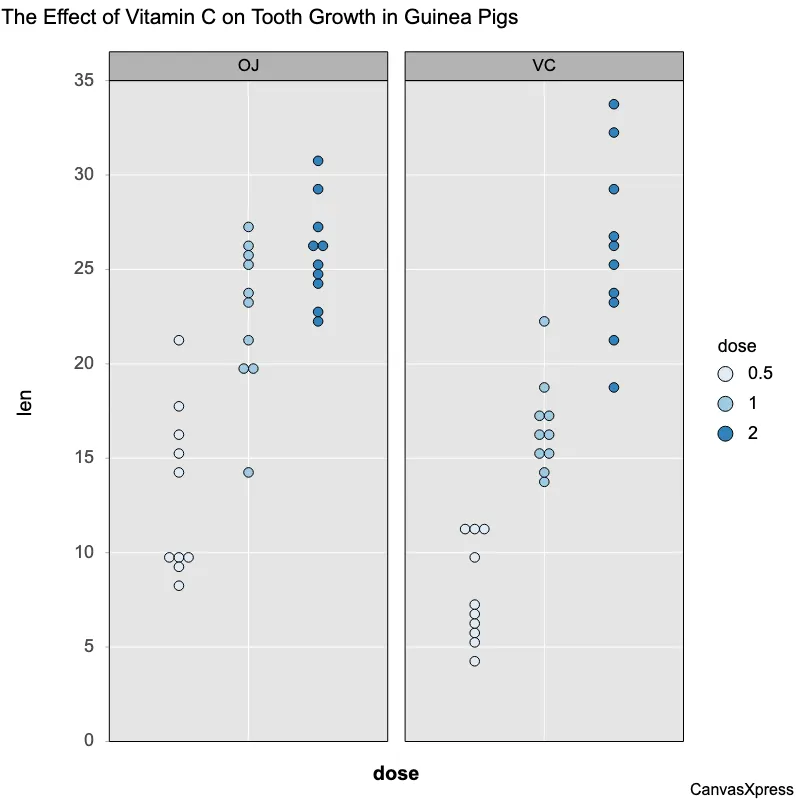
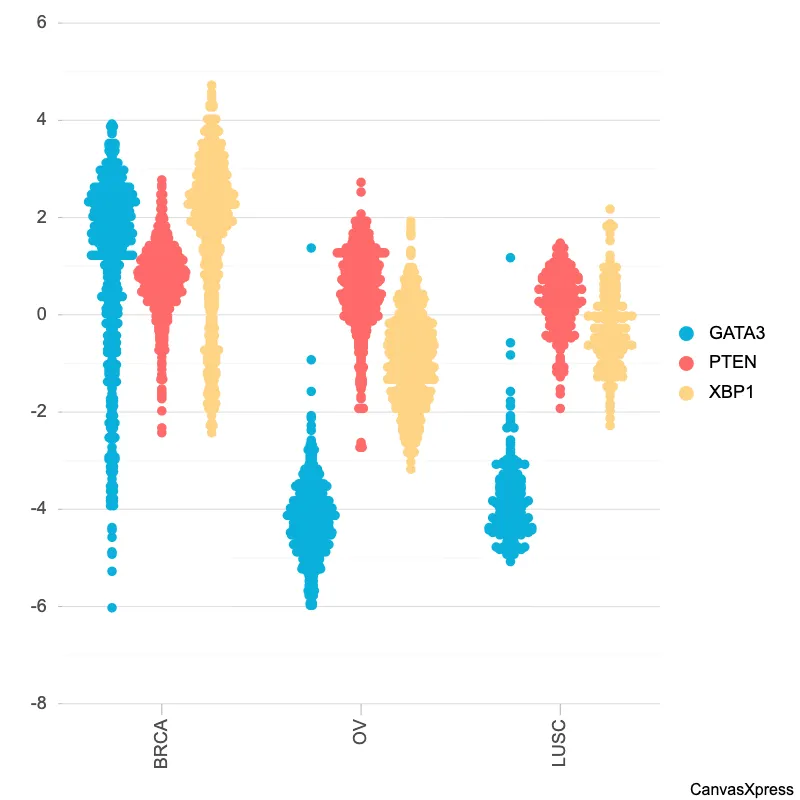
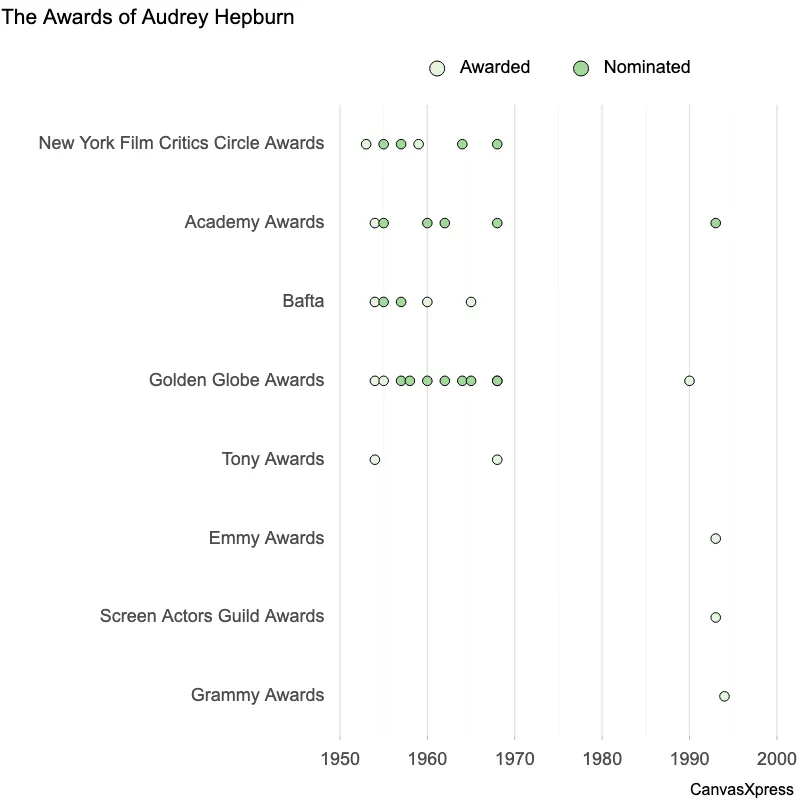
Dot plots are ideal for visualizing distributions, particularly when dealing with smaller datasets. They offer a clear and intuitive way to show the frequency of individual data points. This makes them useful for quickly identifying clusters, outliers, and the overall shape of the data. Compared to histograms, dot plots maintain the identity of each data point. This level of detail is beneficial when precise values are crucial and the sample size is not overwhelmingly large. They are easy to understand and interpret, making them a good choice for presentations and reports aimed at a broad audience.
<html>

  <head>
    <!-- Include the CanvasXpress library in your HTML file -->
    <link rel="stylesheet" href="https://www.canvasxpress.org/dist/canvasXpress.css" type="text/css"/>
    <script src="https://www.canvasxpress.org/dist/canvasXpress.min.js"></script>
  </head>

  <body>

    <!-- Create a canvas element for the chart with the desired dimensions -->
    <div>
      <canvas id="canvasId" width="600" height="600"></canvas>
    </div>


    <!-- Create a script to initialize the chart -->
    <script>

      // Use a data frame (2D-array) for the graph
      var data = [
        [ "Id", "MPG", "Weight", "Drive_Ratio", "Horsepower", "Displacement", "Cylinders", "Country"],
        [ "Buick Estate Wagon", 16.9, 4.36, 2.73, 155, 350, 8, "U.S."],
        [ "Ford Country Squire Wagon", 15.5, 4.054, 2.26, 142, 351, 8, "U.S."],
        [ "Chevy Malibu Wagon", 19.2, 3.605, 2.56, 125, 267, 8, "U.S."],
        [ "Chrysler LeBaron Wagon", 18.5, 3.94, 2.45, 150, 360, 8, "U.S."],
        [ "Chevette", 30, 2.155, 3.7, 68, 98, 4, "U.S."],
        [ "Toyota Corona", 27.5, 2.56, 3.05, 95, 134, 4, "Japan"],
        [ "Datsun 510", 27.2, 2.3, 3.54, 97, 119, 4, "Japan"],
        [ "Dodge Omni", 30.9, 2.23, 3.37, 75, 105, 4, "U.S."],
        [ "Audi 5000", 20.3, 2.83, 3.9, 103, 131, 5, "Germany"],
        [ "Volvo 240 GL", 17, 3.14, 3.5, 125, 163, 6, "Sweden"],
        [ "Saab 99 GLE", 21.6, 2.795, 3.77, 115, 121, 4, "Sweden"],
        [ "Peugeot 694 SL", 16.2, 3.41, 3.58, 133, 163, 6, "France"],
        [ "Buick Century Special", 20.6, 3.38, 2.73, 105, 231, 6, "U.S."],
        [ "Mercury Zephyr", 20.8, 3.07, 3.08, 85, 200, 6, "U.S."],
        [ "Dodge Aspen", 18.6, 3.62, 2.71, 110, 225, 6, "U.S."],
        [ "AMC Concord D/L", 18.1, 3.41, 2.73, 120, 258, 6, "U.S."],
        [ "Chevy Caprice Classic", 17, 3.84, 2.41, 130, 305, 8, "U.S."],
        [ "Ford LTD", 17.6, 3.725, 2.26, 129, 302, 8, "U.S."],
        [ "Mercury Grand Marquis", 16.5, 3.955, 2.26, 138, 351, 8, "U.S."],
        [ "Dodge St Regis", 18.2, 3.83, 2.45, 135, 318, 8, "U.S."],
        [ "Ford Mustang 4", 26.5, 2.585, 3.08, 88, 140, 4, "U.S."],
        [ "Ford Mustang Ghia", 21.9, 2.91, 3.08, 109, 171, 6, "U.S."],
        [ "Mazda GLC", 34.1, 1.975, 3.73, 65, 86, 4, "Japan"],
        [ "Dodge Colt", 35.1, 1.915, 2.97, 80, 98, 4, "Japan"],
        [ "AMC Spirit", 27.4, 2.67, 3.08, 80, 121, 4, "U.S."],
        [ "VW Scirocco", 31.5, 1.99, 3.78, 71, 89, 4, "Germany"],
        [ "Honda Accord LX", 29.5, 2.135, 3.05, 68, 98, 4, "Japan"],
        [ "Buick Skylark", 28.4, 2.67, 2.53, 90, 151, 4, "U.S."],
        // ... (data truncated after 29 records for clarity)
      ]

      // Create the configuration for the graph
      var config = {
        "citation": "Henderson, H. V. and Velleman, P. F. (1981), Building Regression Models Interactively. Biometrics, 37, 391-411.",
        "citationFontStyle": "italic",
        "graphType": "Dotplot",
        "jitter": true,
        "legendColumns": 2,
        "legendInside": true,
        "legendPosition": "bottomRight",
        "showErrorBars": false,
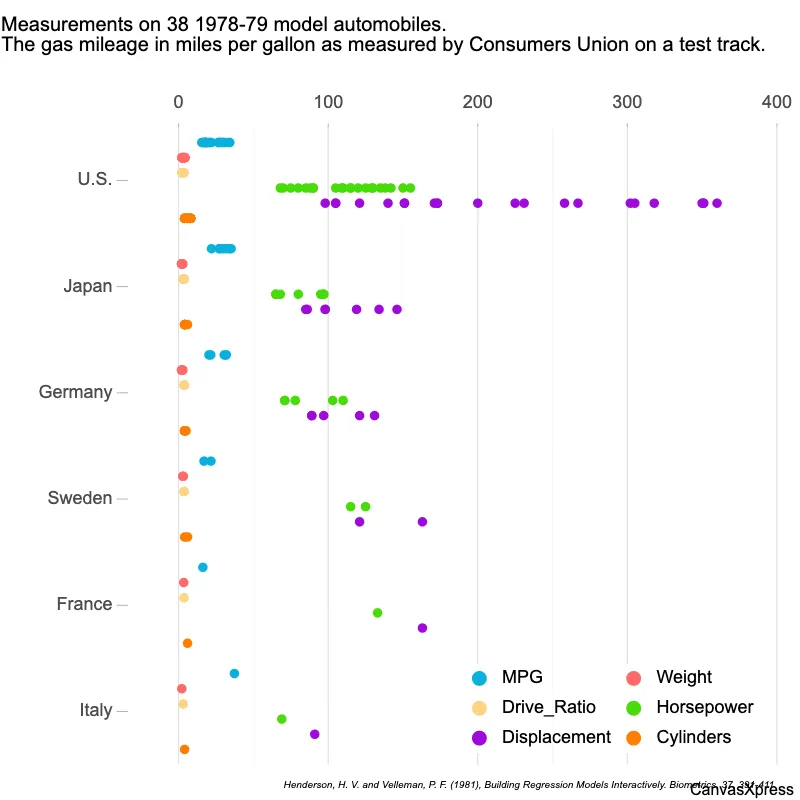
        "title": "Measurements on 38 1978-79 model automobiles.\nThe gas mileage in miles per gallon as measured by Consumers Union on a test track.",
        "xAxis": ["MPG", "Weight", "Drive_Ratio", "Horsepower", "Displacement", "Cylinders"]
      }

      // Event used to create graph (optional)
      var events = false


      // Call the CanvasXpress function to create the graph
      var cX = new CanvasXpress("canvasId", data, config, events);

      // Functions after rendering graph
      cX.groupSamples(["Country"]);

    </script>

  </body>

</html>
<html>

  <head>
    <!-- Include the CanvasXpress library in your HTML file -->
    <link rel="stylesheet" href="https://www.canvasxpress.org/dist/canvasXpress.css" type="text/css"/>
    <script src="https://www.canvasxpress.org/dist/canvasXpress.min.js"></script>
  </head>

  <body>

    <!-- Create a canvas element for the chart with the desired dimensions -->
    <div>
      <canvas id="canvasId" width="600" height="600"></canvas>
    </div>


    <!-- Create a script to initialize the chart -->
    <script>

      // Create the data for the graph
      var data = {
         "x" : {
            "Country" : ["U.S.","U.S.","U.S.","U.S.","U.S.","Japan","Japan","U.S.","Germany","Sweden","Sweden","France","U.S.","U.S.","U.S.","U.S.","U.S.","U.S.","U.S.","U.S.","U.S.","U.S.","Japan","Japan","U.S.","Germany","Japan","U.S.","U.S.","U.S.","U.S.","U.S.","Japan","Italy","Germany","Japan","Germany","Germany"]
         },
         "y" : {
            "data" : [
              [16.9,15.5,19.2,18.5,30,27.5,27.2,30.9,20.3,17,21.6,16.2,20.6,20.8,18.6,18.1,17,17.6,16.5,18.2,26.5,21.9,34.1,35.1,27.4,31.5,29.5,28.4,28.8,26.8,33.5,34.2,31.8,37.3,30.5,22,21.5,31.9],
              [4.36,4.054,3.605,3.94,2.155,2.56,2.3,2.23,2.83,3.14,2.795,3.41,3.38,3.07,3.62,3.41,3.84,3.725,3.955,3.83,2.585,2.91,1.975,1.915,2.67,1.99,2.135,2.67,2.595,2.7,2.556,2.2,2.02,2.13,2.19,2.815,2.6,1.925],
              [2.73,2.26,2.56,2.45,3.7,3.05,3.54,3.37,3.9,3.5,3.77,3.58,2.73,3.08,2.71,2.73,2.41,2.26,2.26,2.45,3.08,3.08,3.73,2.97,3.08,3.78,3.05,2.53,2.69,2.84,2.69,3.37,3.7,3.1,3.7,3.7,3.64,3.78],
              [155,142,125,150,68,95,97,75,103,125,115,133,105,85,110,120,130,129,138,135,88,109,65,80,80,71,68,90,115,115,90,70,65,69,78,97,110,71],
              [350,351,267,360,98,134,119,105,131,163,121,163,231,200,225,258,305,302,351,318,140,171,86,98,121,89,98,151,173,173,151,105,85,91,97,146,121,89],
              [8,8,8,8,4,4,4,4,5,6,4,6,6,6,6,6,8,8,8,8,4,6,4,4,4,4,4,4,6,6,4,4,4,4,4,6,4,4]
            ],
            "smps" : ["Buick Estate Wagon","Ford Country Squire Wagon","Chevy Malibu Wagon","Chrysler LeBaron Wagon","Chevette","Toyota Corona","Datsun 510","Dodge Omni","Audi 5000","Volvo 240 GL","Saab 99 GLE","Peugeot 694 SL","Buick Century Special","Mercury Zephyr","Dodge Aspen","AMC Concord D/L","Chevy Caprice Classic","Ford LTD","Mercury Grand Marquis","Dodge St Regis","Ford Mustang 4","Ford Mustang Ghia","Mazda GLC","Dodge Colt","AMC Spirit","VW Scirocco","Honda Accord LX","Buick Skylark","Chevy Citation","Olds Omega","Pontiac Phoenix","Plymouth Horizon","Datsun 210","Fiat Strada","VW Dasher","Datsun 810","BMW 320i","VW Rabbit"],
            "vars" : ["MPG","Weight","Drive_Ratio","Horsepower","Displacement","Cylinders"]
         }
      }

      // Create the configuration for the graph
      var config = {
        "citation": "Henderson, H. V. and Velleman, P. F. (1981), Building Regression Models Interactively. Biometrics, 37, 391-411.",
        "citationFontStyle": "italic",
        "graphType": "Dotplot",
        "jitter": true,
        "legendColumns": 2,
        "legendInside": true,
        "legendPosition": "bottomRight",
        "showErrorBars": false,
        "title": "Measurements on 38 1978-79 model automobiles.\nThe gas mileage in miles per gallon as measured by Consumers Union on a test track.",
        "xAxis": ["MPG", "Weight", "Drive_Ratio", "Horsepower", "Displacement", "Cylinders"]
      }

      // Event used to create graph (optional)
      var events = false


      // Call the CanvasXpress function to create the graph
      var cX = new CanvasXpress("canvasId", data, config, events);

      // Functions after rendering graph
      cX.groupSamples(["Country"]);

    </script>

  </body>

</html>
library(canvasXpress)
y=read.table("https://www.canvasxpress.org/data/r/cX-cars-dat.txt", header=TRUE, sep="\t", quote="", row.names=1, fill=TRUE, check.names=FALSE, stringsAsFactors=FALSE)
x=read.table("https://www.canvasxpress.org/data/r/cX-cars-smp.txt", header=TRUE, sep="\t", quote="", row.names=1, fill=TRUE, check.names=FALSE, stringsAsFactors=FALSE)
canvasXpress(
  data=y,
  smpAnnot=x,
  citation="Henderson, H. V. and Velleman, P. F. (1981), Building Regression Models Interactively. Biometrics, 37, 391-411.",
  citationFontStyle="italic",
  graphType="Dotplot",
  jitter=TRUE,
  legendColumns=2,
  legendInside=TRUE,
  legendPosition="bottomRight",
  showErrorBars=FALSE,
  title="Measurements on 38 1978-79 model automobiles.\nThe gas mileage in miles per gallon as measured by Consumers Union on a test track.",
  xAxis=list("MPG", "Weight", "Drive_Ratio", "Horsepower", "Displacement", "Cylinders"),
  afterRender=list(list("groupSamples", list("Country")))
)
