SAS Swim Plot: Data Comparison Made Easy
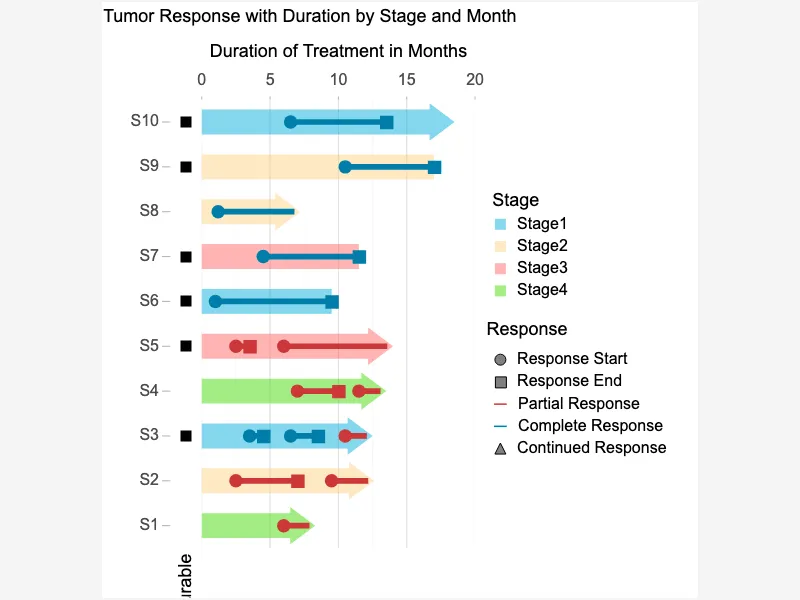
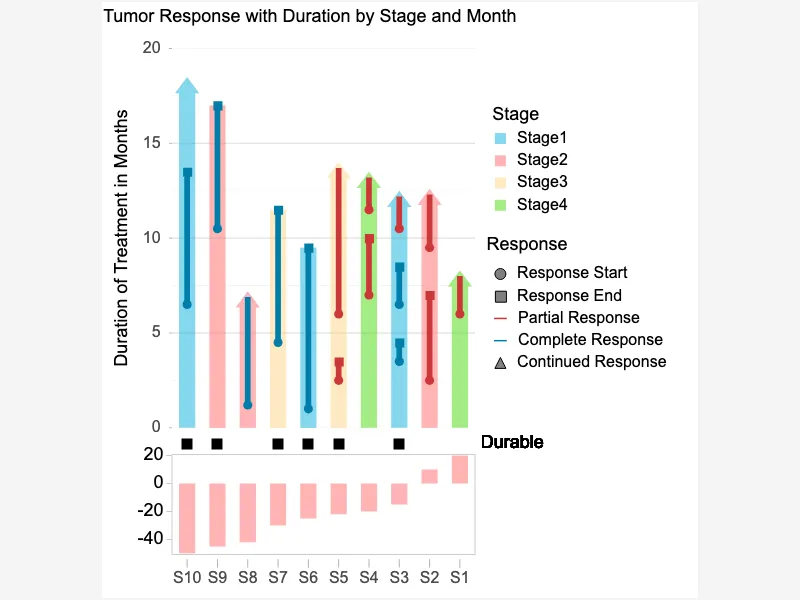
A swimmer plot is a graphical tool used to visualize individual subject data over time, commonly in clinical and oncology studies. Each horizontal bar ("lane") represents one subject, with its length encoding duration of treatment or follow-up, while overlaid markers and segments capture events such as response, dose changes, and ongoing status. Swimmer plots make it easy to compare timelines, durations, and outcomes across many subjects at a glance.


<html>

  <head>
    <!-- Include the CanvasXpress library in your HTML file -->
    <link rel="stylesheet" href="https://www.canvasxpress.org/dist/canvasXpress.css" type="text/css"/>
    <script src="https://www.canvasxpress.org/dist/canvasXpress.min.js"></script>
  </head>

  <body>

    <!-- Create a canvas element for the chart with the desired dimensions -->
    <div>
      <canvas id="canvasId" width="600" height="600"></canvas>
    </div>


    <!-- Create a script to initialize the chart -->
    <script>

      // Use a data frame (2D-array) for the graph
      var data = [
        [ "Id", "high", "start", "end", "High Cap", "Status", "Stage", "Subject", "Response", "Durable"],
        [ "S1", 8.3, 6, null, "Arrow", "Partial Response", "Stage4", "S1", 20, false],
        [ "S2", 12.6, 2.5, 7, "Arrow", "Partial Response", "Stage2", "S2", 10, false],
        [ "S3", 12.6, 9.5, null, "Arrow", "Partial Response", "Stage2", "S2", 10, false],
        [ "S4", 12.5, 3.5, 4.5, "Arrow", "Complete Response", "Stage1", "S3", -15, true],
        [ "S5", 12.5, 6.5, 8.5, "Arrow", "Complete Response", "Stage1", "S3", -15, false],
        [ "S6", 12.5, 10.5, null, "Arrow", "Partial Response", "Stage1", "S3", -15, false],
        [ "S7", 13.5, 7, 10, "Arrow", "Partial Response", "Stage4", "S4", -20, false],
        [ "S8", 13.5, 11.5, null, "Arrow", "Partial Response", "Stage4", "S4", -20, false],
        [ "S9", 14, 2.5, 3.5, "Arrow", "Partial Response", "Stage3", "S5", -22, true],
        [ "S10", 14, 6, null, "Arrow", "Partial Response", "Stage3", "S5", -22, false],
        [ "S11", 9.5, 1, 9.5, null, "Complete Response", "Stage1", "S6", -25, true],
        [ "S12", 11.5, 4.5, 11.5, null, "Complete Response", "Stage3", "S7", -30, true],
        [ "S13", 7.2, 1.2, null, "Arrow", "Complete Response", "Stage2", "S8", -42, false],
        [ "S14", 17, 10.5, 17, null, "Complete Response", "Stage2", "S9", -45, true],
        [ "S15", 18.5, 6.5, 13.5, "Arrow", "Complete Response", "Stage1", "S10", -50, true ]
      ];

      // Create the configuration for the graph
      var config = {
         "barType" : "swimmer",
         "colorBy" : "Stage",
         "colorScheme" : "CanvasXpress",
         "graphOrientation" : "horizontal",
         "graphType" : "Bar",
         "groupingFactors" : ["Subject"],
         "objectColorTransparency" : 0.5,
         "smpOverlays" : ["Durable"],
         "swimDurable" : "Durable",
         "swimEnd" : "end",
         "swimHigh" : "high",
         "swimHighCap" : "High Cap",
         "swimStart" : "start",
         "swimStatus" : "Status",
         "sortData" : [
           ["cat", "smp", "Response"]
         ],
         "title" : "Tumor Response with Duration by Stage and Month",
         "xAxisTitle" : "Duration of Treatment in Months",
         "xAxis": ["high","start","end"]
      }

      // Event used to create graph (optional)
      var events = false

      // Call the CanvasXpress function to create the graph
      var cX = new CanvasXpress("canvasId", data, config, events);

    </script>

  </body>

</html>
<html>

  <head>
    <!-- Include the CanvasXpress library in your HTML file -->
    <link rel="stylesheet" href="https://www.canvasxpress.org/dist/canvasXpress.css" type="text/css"/>
    <script src="https://www.canvasxpress.org/dist/canvasXpress.min.js"></script>
  </head>

  <body>

    <!-- Create a canvas element for the chart with the desired dimensions -->
    <div>
      <canvas id="canvasId" width="600" height="600"></canvas>
    </div>


    <!-- Create a script to initialize the chart -->
    <script>

      // Create the data for the graph
      var data = {
         "x" : {
            "Durable" : [false,false,false,true,false,false,false,false,true,false,true,true,false,true,true],
            "High Cap" : ["Arrow","Arrow","Arrow","Arrow","Arrow","Arrow","Arrow","Arrow","Arrow","Arrow",null,null,"Arrow",null,"Arrow"],
            "Response" : [20,10,10,-15,-15,-15,-20,-20,-22,-22,-25,-30,-42,-45,-50],
            "Stage" : ["Stage4","Stage2","Stage2","Stage1","Stage1","Stage1","Stage4","Stage4","Stage3","Stage3","Stage1","Stage3","Stage2","Stage2","Stage1"],
            "Status" : ["Partial Response","Partial Response","Partial Response","Complete Response","Complete Response","Partial Response","Partial Response","Partial Response","Partial Response","Partial Response","Complete Response","Complete Response","Complete Response","Complete Response","Complete Response"],
            "Subject" : ["S1","S2","S2","S3","S3","S3","S4","S4","S5","S5","S6","S7","S8","S9","S10"]
         },
         "y" : {
            "data" : [
              [8.3,12.6,12.6,12.5,12.5,12.5,13.5,13.5,14,14,9.5,11.5,7.2,17,18.5],
              [6,2.5,9.5,3.5,6.5,10.5,7,11.5,2.5,6,1,4.5,1.2,10.5,6.5],
              [null,7,null,4.5,8.5,null,10,null,3.5,null,9.5,11.5,null,17,13.5]
            ],
            "smps" : ["S1","S2","S3","S4","S5","S6","S7","S8","S9","S10","S11","S12","S13","S14","S15"],
            "vars" : ["high","start","end"]
         }
      }

      // Create the configuration for the graph
      var config = {
         "barType" : "swimmer",
         "colorBy" : "Stage",
         "colorScheme" : "CanvasXpress",
         "graphOrientation" : "horizontal",
         "graphType" : "Bar",
         "groupingFactors" : ["Subject"],
         "objectColorTransparency" : 0.5,
         "smpOverlays" : ["Durable"],
         "swimDurable" : "Durable",
         "swimEnd" : "end",
         "swimHigh" : "high",
         "swimHighCap" : "High Cap",
         "swimStart" : "start",
         "swimStatus" : "Status",
         "sortData" : [
           ["cat", "smp", "Response"]
         ],
         "title" : "Tumor Response with Duration by Stage and Month",
         "xAxisTitle" : "Duration of Treatment in Months",
         "xAxis": ["high","start","end"]
      }

      // Event used to create graph (optional)
      var events = false

            // Call the CanvasXpress function to create the graph
      var cX = new CanvasXpress("canvasId", data, config, events);

    </script>

  </body>

</html>
library(canvasXpress)
y=read.table("https://www.canvasxpress.org/data/r/cX-swimmer-dat.txt", header=TRUE, sep="\t", quote="", row.names=1, fill=TRUE, check.names=FALSE, stringsAsFactors=FALSE)
x=read.table("https://www.canvasxpress.org/data/r/cX-swimmer-smp.txt", header=TRUE, sep="\t", quote="", row.names=1, fill=TRUE, check.names=FALSE, stringsAsFactors=FALSE)
canvasXpress(
data=y,
smpAnnot=x,
barType="swimmer",
colorBy="Stage",
colorScheme="CanvasXpress",
graphOrientation="horizontal",
graphType="Bar",
groupingFactors=list("Subject"),
objectColorTransparency=0.5,
smpOverlays=list("Durable"),
sortData=list(list("cat", "smp", "Response")),
swimDurable="Durable",
swimEnd="end",
swimHigh="high",
swimHighCap="High Cap",
swimStart="start",
swimStatus="Status",
title="Tumor Response with Duration by Stage and Month",
xAxis=list("high", "start", "end"),
xAxisTitle="Duration of Treatment in Months"
)
from canvasxpress.canvas import CanvasXpress
from canvasxpress.plot import show_in_browser

if __name__ == "__main__":
  # Define the chart with its data and configuration
  chart: CanvasXpress = CanvasXpress(
    render_to = "swimmer1",
    data = {
      "x": {
        "Durable": [False, False, False, True, False, False, False, False, True, False, True, True, False, True, True],
        "High Cap": ["Arrow", "Arrow", "Arrow", "Arrow", "Arrow", "Arrow", "Arrow", "Arrow", "Arrow", "Arrow", None, None, "Arrow", None, "Arrow"],
        "Response": [20, 10, 10, -15, -15, -15, -20, -20, -22, -22, -25, -30, -42, -45, -50],
        "Stage": ["Stage4", "Stage2", "Stage2", "Stage1", "Stage1", "Stage1", "Stage4", "Stage4", "Stage3", "Stage3", "Stage1", "Stage3", "Stage2", "Stage2", "Stage1"],
        "Status": ["Partial Response", "Partial Response", "Partial Response", "Complete Response", "Complete Response", "Partial Response", "Partial Response", "Partial Response", "Partial Response", "Partial Response", "Complete Response", "Complete Response", "Complete Response", "Complete Response", "Complete Response"],
        "Subject": ["S1", "S2", "S2", "S3", "S3", "S3", "S4", "S4", "S5", "S5", "S6", "S7", "S8", "S9", "S10"]
      },
      "y": {
        "data": [
          [8.3, 12.6, 12.6, 12.5, 12.5, 12.5, 13.5, 13.5, 14, 14, 9.5, 11.5, 7.2, 17, 18.5],
          [6, 2.5, 9.5, 3.5, 6.5, 10.5, 7, 11.5, 2.5, 6, 1, 4.5, 1.2, 10.5, 6.5],
          [None, 7, None, 4.5, 8.5, None, 10, None, 3.5, None, 9.5, 11.5, None, 17, 13.5]
        ],
        "smps": ["S1", "S2", "S3", "S4", "S5", "S6", "S7", "S8", "S9", "S10", "S11", "S12", "S13", "S14", "S15"],
        "vars": ["high", "start", "end"]
      }
    },
    config = {
      "barType": "swimmer",
      "colorBy": "Stage",
      "colorScheme": "CanvasXpress",
      "graphOrientation": "horizontal",
      "graphType": "Bar",
      "groupingFactors": ["Subject"],
      "objectColorTransparency": 0.5,
      "smpOverlays": ["Durable"],
      "swimDurable": "Durable",
      "swimEnd": "end",
      "swimHigh": "high",
      "swimHighCap": "High Cap",
      "swimStart": "start",
      "swimStatus": "Status",
      "sortData": [
        ["cat", "smp", "Response"]
      ],
      "title": "Tumor Response with Duration by Stage and Month",
      "xAxisTitle": "Duration of Treatment in Months",
      "xAxis": ["high", "start", "end"]
    },
    width = 600,
    height = 600
  )

  # Display the chart in its own Web page
  show_in_browser(chart)
Run this notebook:

from canvasxpress.canvas import CanvasXpress
from canvasxpress.plot import graph

graph(
  CanvasXpress(
    render_to = "swimmer1",
    data = {
      "x": {
        "Durable": [False, False, False, True, False, False, False, False, True, False, True, True, False, True, True],
        "High Cap": ["Arrow", "Arrow", "Arrow", "Arrow", "Arrow", "Arrow", "Arrow", "Arrow", "Arrow", "Arrow", None, None, "Arrow", None, "Arrow"],
        "Response": [20, 10, 10, -15, -15, -15, -20, -20, -22, -22, -25, -30, -42, -45, -50],
        "Stage": ["Stage4", "Stage2", "Stage2", "Stage1", "Stage1", "Stage1", "Stage4", "Stage4", "Stage3", "Stage3", "Stage1", "Stage3", "Stage2", "Stage2", "Stage1"],
        "Status": ["Partial Response", "Partial Response", "Partial Response", "Complete Response", "Complete Response", "Partial Response", "Partial Response", "Partial Response", "Partial Response", "Partial Response", "Complete Response", "Complete Response", "Complete Response", "Complete Response", "Complete Response"],
        "Subject": ["S1", "S2", "S2", "S3", "S3", "S3", "S4", "S4", "S5", "S5", "S6", "S7", "S8", "S9", "S10"]
      },
      "y": {
        "data": [
          [8.3, 12.6, 12.6, 12.5, 12.5, 12.5, 13.5, 13.5, 14, 14, 9.5, 11.5, 7.2, 17, 18.5],
          [6, 2.5, 9.5, 3.5, 6.5, 10.5, 7, 11.5, 2.5, 6, 1, 4.5, 1.2, 10.5, 6.5],
          [None, 7, None, 4.5, 8.5, None, 10, None, 3.5, None, 9.5, 11.5, None, 17, 13.5]
        ],
        "smps": ["S1", "S2", "S3", "S4", "S5", "S6", "S7", "S8", "S9", "S10", "S11", "S12", "S13", "S14", "S15"],
        "vars": ["high", "start", "end"]
      }
    },
    config = {
      "barType": "swimmer",
      "colorBy": "Stage",
      "colorScheme": "CanvasXpress",
      "graphOrientation": "horizontal",
      "graphType": "Bar",
      "groupingFactors": ["Subject"],
      "objectColorTransparency": 0.5,
      "smpOverlays": ["Durable"],
      "swimDurable": "Durable",
      "swimEnd": "end",
      "swimHigh": "high",
      "swimHighCap": "High Cap",
      "swimStart": "start",
      "swimStatus": "Status",
      "sortData": [
        ["cat", "smp", "Response"]
      ],
      "title": "Tumor Response with Duration by Stage and Month",
      "xAxisTitle": "Duration of Treatment in Months",
      "xAxis": ["high", "start", "end"]
    },
    width = 600,
    height = 600
  )
)
using CanvasXpress

canvasxpress(Dict(
  "x" => Dict(
    "Durable" => [false, false, false, true, false, false, false, false, true, false, true, true, false, true, true],
    "High Cap" => ["Arrow", "Arrow", "Arrow", "Arrow", "Arrow", "Arrow", "Arrow", "Arrow", "Arrow", "Arrow", nothing, nothing, "Arrow", nothing, "Arrow"],
    "Response" => [20, 10, 10, -15, -15, -15, -20, -20, -22, -22, -25, -30, -42, -45, -50],
    "Stage" => ["Stage4", "Stage2", "Stage2", "Stage1", "Stage1", "Stage1", "Stage4", "Stage4", "Stage3", "Stage3", "Stage1", "Stage3", "Stage2", "Stage2", "Stage1"],
    "Status" => ["Partial Response", "Partial Response", "Partial Response", "Complete Response", "Complete Response", "Partial Response", "Partial Response", "Partial Response", "Partial Response", "Partial Response", "Complete Response", "Complete Response", "Complete Response", "Complete Response", "Complete Response"],
    "Subject" => ["S1", "S2", "S2", "S3", "S3", "S3", "S4", "S4", "S5", "S5", "S6", "S7", "S8", "S9", "S10"]
  ),
  "y" => Dict(
    "data" => [
      [8.3, 12.6, 12.6, 12.5, 12.5, 12.5, 13.5, 13.5, 14, 14, 9.5, 11.5, 7.2, 17, 18.5],
      [6, 2.5, 9.5, 3.5, 6.5, 10.5, 7, 11.5, 2.5, 6, 1, 4.5, 1.2, 10.5, 6.5],
      [nothing, 7, nothing, 4.5, 8.5, nothing, 10, nothing, 3.5, nothing, 9.5, 11.5, nothing, 17, 13.5]
    ],
    "smps" => ["S1", "S2", "S3", "S4", "S5", "S6", "S7", "S8", "S9", "S10", "S11", "S12", "S13", "S14", "S15"],
    "vars" => ["high", "start", "end"]
  )
);
  barType = "swimmer",
  colorBy = "Stage",
  colorScheme = "CanvasXpress",
  graphOrientation = "horizontal",
  graphType = "Bar",
  groupingFactors = ["Subject"],
  objectColorTransparency = 0.5,
  smpOverlays = ["Durable"],
  swimDurable = "Durable",
  swimEnd = "end",
  swimHigh = "high",
  swimHighCap = "High Cap",
  swimStart = "start",
  swimStatus = "Status",
  sortData = [
    ["cat", "smp", "Response"]
  ],
  title = "Tumor Response with Duration by Stage and Month",
  xAxisTitle = "Duration of Treatment in Months",
  xAxis = ["high", "start", "end"]
)