Maximize Insights with 3D Scatter Plots
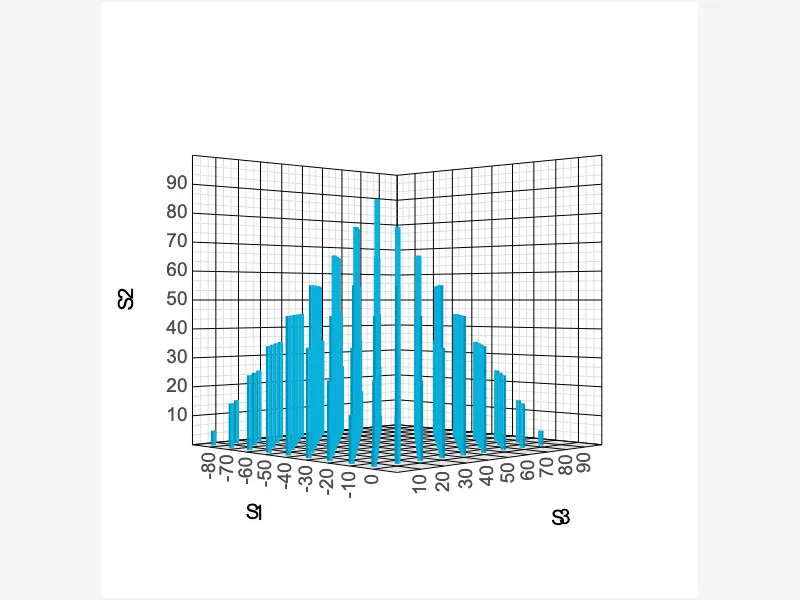
3D plots add a third spatial dimension to a visualization, letting you encode an extra variable along the depth axis. CanvasXpress renders 3D bar graphs and 3D scatter plots that can be rotated and explored interactively, revealing structure and relationships that are hard to see in two dimensions. They are well suited to multivariate data where three quantitative axes tell the story together.


<html>

  <head>
    <!-- Include the CanvasXpress library in your HTML file -->
    <link rel="stylesheet" href="https://www.canvasxpress.org/dist/canvasXpress.css" type="text/css"/>
    <script src="https://www.canvasxpress.org/dist/canvasXpress.min.js"></script>
  </head>

  <body>

    <!-- Create a canvas element for the chart with the desired dimensions -->
    <div>
      <canvas id="canvasId" width="600" height="600"></canvas>
    </div>


    <!-- Create a script to initialize the chart -->
    <script>

      // Use a data frame (2D-array) for the graph
      var data = [
        [ "Id", "S1", "S2", "S3"],
        [ "V1", -5, 5, 5],
        [ "V2", -5, 15, 15],
        [ "V3", -5, 25, 25],
        [ "V4", -5, 35, 35],
        [ "V5", -5, 45, 45],
        [ "V6", -5, 35, 55],
        [ "V7", -5, 25, 65],
        [ "V8", -5, 15, 75],
        [ "V9", -5, 5, 85],
        [ "V10", -15, 15, 5],
        [ "V11", -15, 25, 15],
        [ "V12", -15, 35, 25],
        [ "V13", -15, 45, 35],
        [ "V14", -15, 55, 45],
        [ "V15", -15, 45, 55],
        [ "V16", -15, 35, 65],
        [ "V17", -15, 25, 75],
        [ "V18", -15, 15, 85],
        [ "V19", -25, 25, 5],
        [ "V20", -25, 35, 15],
        [ "V21", -25, 45, 25],
        [ "V22", -25, 55, 35],
        [ "V23", -25, 65, 45],
        [ "V24", -25, 55, 55],
        [ "V25", -25, 45, 65],
        [ "V26", -25, 35, 75],
        [ "V27", -25, 25, 85],
        [ "V28", -35, 35, 5],
        // ... (data truncated after 29 records for clarity)
      ]

      // Create the configuration for the graph
      var config = {
        "graphType": "Scatter3D",
        "scatterType": "bar",
        "xAxis": ["S1"],
        "yAxis": ["S2"],
        "zAxis": ["S3"]
      }

      // Event used to create graph (optional)
      var events = false

      // Call the CanvasXpress function to create the graph
      var cX = new CanvasXpress("canvasId", data, config, events);

    </script>

  </body>

</html>
<html>

  <head>
    <!-- Include the CanvasXpress library in your HTML file -->
    <link rel="stylesheet" href="https://www.canvasxpress.org/dist/canvasXpress.css" type="text/css"/>
    <script src="https://www.canvasxpress.org/dist/canvasXpress.min.js"></script>
  </head>

  <body>

    <!-- Create a canvas element for the chart with the desired dimensions -->
    <div>
      <canvas id="canvasId" width="600" height="600"></canvas>
    </div>


    <!-- Create a script to initialize the chart -->
    <script>

      // Create the data for the graph
      var data = {
         "y" : {
            "data" : [
              [-5,5,5],
              [-5,15,15],
              [-5,25,25],
              [-5,35,35],
              [-5,45,45],
              [-5,35,55],
              [-5,25,65],
              [-5,15,75],
              [-5,5,85],
              [-15,15,5],
              [-15,25,15],
              [-15,35,25],
              [-15,45,35],
              [-15,55,45],
              [-15,45,55],
              [-15,35,65],
              [-15,25,75],
              [-15,15,85],
              [-25,25,5],
              [-25,35,15],
              [-25,45,25],
              [-25,55,35],
              [-25,65,45],
              [-25,55,55],
              [-25,45,65],
              [-25,35,75],
              [-25,25,85],
              [-35,35,5],
              [-35,45,15],
              [-35,55,25],
              [-35,65,35],
              [-35,75,45],
              [-35,65,55],
              [-35,55,65],
              [-35,45,75],
              [-35,35,85],
              [-45,45,5],
              [-45,55,15],
              [-45,65,25],
              [-45,75,35],
              [-45,85,45],
              [-45,75,55],
              [-45,65,65],
              [-45,55,75],
              [-45,45,85],
              [-55,35,5],
              [-55,45,15],
              [-55,55,25],
              [-55,65,35],
              [-55,75,45],
              [-55,65,55],
              [-55,55,65],
              [-55,45,75],
              [-55,35,85],
              [-65,25,5],
              [-65,35,15],
              [-65,45,25],
              [-65,55,35],
              [-65,65,45],
              [-65,55,55],
              [-65,45,65],
              [-65,35,75],
              [-65,25,85],
              [-75,15,5],
              [-75,25,15],
              [-75,35,25],
              [-75,45,35],
              [-75,55,45],
              [-75,45,55],
              [-75,35,65],
              [-75,25,75],
              [-75,15,85],
              [-85,5,5],
              [-85,15,15],
              [-85,25,25],
              [-85,35,35],
              [-85,45,45],
              [-85,35,55],
              [-85,25,65],
              [-85,15,75],
              [-85,5,85]
            ],
            "smps" : ["S1","S2","S3"],
            "vars" : ["V1","V2","V3","V4","V5","V6","V7","V8","V9","V10","V11","V12","V13","V14","V15","V16","V17","V18","V19","V20","V21","V22","V23","V24","V25","V26","V27","V28","V29","V30","V31","V32","V33","V34","V35","V36","V37","V38","V39","V40","V41","V42","V43","V44","V45","V46","V47","V48","V49","V50","V51","V52","V53","V54","V55","V56","V57","V58","V59","V60","V61","V62","V63","V64","V65","V66","V67","V68","V69","V70","V71","V72","V73","V74","V75","V76","V77","V78","V79","V80","V81"]
         }
      }

      // Create the configuration for the graph
      var config = {
        "graphType": "Scatter3D",
        "scatterType": "bar",
        "xAxis": ["S1"],
        "yAxis": ["S2"],
        "zAxis": ["S3"]
      }

      // Event used to create graph (optional)
      var events = false

            // Call the CanvasXpress function to create the graph
      var cX = new CanvasXpress("canvasId", data, config, events);

    </script>

  </body>

</html>
from canvasxpress.canvas import CanvasXpress
from canvasxpress.plot import show_in_browser

if __name__ == "__main__":
  # Define the chart with its data and configuration
  chart: CanvasXpress = CanvasXpress(
    render_to = "cx3dplots3",
    data = {
      "y": {
        "data": [
          [-5, 5, 5],
          [-5, 15, 15],
          [-5, 25, 25],
          [-5, 35, 35],
          [-5, 45, 45],
          [-5, 35, 55],
          [-5, 25, 65],
          [-5, 15, 75],
          [-5, 5, 85],
          [-15, 15, 5],
          [-15, 25, 15],
          [-15, 35, 25],
          [-15, 45, 35],
          [-15, 55, 45],
          [-15, 45, 55],
          [-15, 35, 65],
          [-15, 25, 75],
          [-15, 15, 85],
          [-25, 25, 5],
          [-25, 35, 15],
          [-25, 45, 25],
          [-25, 55, 35],
          [-25, 65, 45],
          [-25, 55, 55],
          [-25, 45, 65],
          [-25, 35, 75],
          [-25, 25, 85],
          [-35, 35, 5],
          [-35, 45, 15],
          [-35, 55, 25],
          [-35, 65, 35],
          [-35, 75, 45],
          [-35, 65, 55],
          [-35, 55, 65],
          [-35, 45, 75],
          [-35, 35, 85],
          [-45, 45, 5],
          [-45, 55, 15],
          [-45, 65, 25],
          [-45, 75, 35],
          [-45, 85, 45],
          [-45, 75, 55],
          [-45, 65, 65],
          [-45, 55, 75],
          [-45, 45, 85],
          [-55, 35, 5],
          [-55, 45, 15],
          [-55, 55, 25],
          [-55, 65, 35],
          [-55, 75, 45],
          [-55, 65, 55],
          [-55, 55, 65],
          [-55, 45, 75],
          [-55, 35, 85],
          [-65, 25, 5],
          [-65, 35, 15],
          [-65, 45, 25],
          [-65, 55, 35],
          [-65, 65, 45],
          [-65, 55, 55],
          [-65, 45, 65],
          [-65, 35, 75],
          [-65, 25, 85],
          [-75, 15, 5],
          [-75, 25, 15],
          [-75, 35, 25],
          [-75, 45, 35],
          [-75, 55, 45],
          [-75, 45, 55],
          [-75, 35, 65],
          [-75, 25, 75],
          [-75, 15, 85],
          [-85, 5, 5],
          [-85, 15, 15],
          [-85, 25, 25],
          [-85, 35, 35],
          [-85, 45, 45],
          [-85, 35, 55],
          [-85, 25, 65],
          [-85, 15, 75],
          [-85, 5, 85]
        ],
        "smps": ["S1", "S2", "S3"],
        "vars": ["V1", "V2", "V3", "V4", "V5", "V6", "V7", "V8", "V9", "V10", "V11", "V12", "V13", "V14", "V15", "V16", "V17", "V18", "V19", "V20", "V21", "V22", "V23", "V24", "V25", "V26", "V27", "V28", "V29", "V30", "V31", "V32", "V33", "V34", "V35", "V36", "V37", "V38", "V39", "V40", "V41", "V42", "V43", "V44", "V45", "V46", "V47", "V48", "V49", "V50", "V51", "V52", "V53", "V54", "V55", "V56", "V57", "V58", "V59", "V60", "V61", "V62", "V63", "V64", "V65", "V66", "V67", "V68", "V69", "V70", "V71", "V72", "V73", "V74", "V75", "V76", "V77", "V78", "V79", "V80", "V81"]
      }
    },
    config = {
      "graphType": "Scatter3D",
      "scatterType": "bar",
      "xAxis": ["S1"],
      "yAxis": ["S2"],
      "zAxis": ["S3"]
    },
    width = 600,
    height = 600
  )

  # Display the chart in its own Web page
  show_in_browser(chart)
Run this notebook:

from canvasxpress.canvas import CanvasXpress
from canvasxpress.plot import graph

graph(
  CanvasXpress(
    render_to = "cx3dplots3",
    data = {
      "y": {
        "data": [
          [-5, 5, 5],
          [-5, 15, 15],
          [-5, 25, 25],
          [-5, 35, 35],
          [-5, 45, 45],
          [-5, 35, 55],
          [-5, 25, 65],
          [-5, 15, 75],
          [-5, 5, 85],
          [-15, 15, 5],
          [-15, 25, 15],
          [-15, 35, 25],
          [-15, 45, 35],
          [-15, 55, 45],
          [-15, 45, 55],
          [-15, 35, 65],
          [-15, 25, 75],
          [-15, 15, 85],
          [-25, 25, 5],
          [-25, 35, 15],
          [-25, 45, 25],
          [-25, 55, 35],
          [-25, 65, 45],
          [-25, 55, 55],
          [-25, 45, 65],
          [-25, 35, 75],
          [-25, 25, 85],
          [-35, 35, 5],
          [-35, 45, 15],
          [-35, 55, 25],
          [-35, 65, 35],
          [-35, 75, 45],
          [-35, 65, 55],
          [-35, 55, 65],
          [-35, 45, 75],
          [-35, 35, 85],
          [-45, 45, 5],
          [-45, 55, 15],
          [-45, 65, 25],
          [-45, 75, 35],
          [-45, 85, 45],
          [-45, 75, 55],
          [-45, 65, 65],
          [-45, 55, 75],
          [-45, 45, 85],
          [-55, 35, 5],
          [-55, 45, 15],
          [-55, 55, 25],
          [-55, 65, 35],
          [-55, 75, 45],
          [-55, 65, 55],
          [-55, 55, 65],
          [-55, 45, 75],
          [-55, 35, 85],
          [-65, 25, 5],
          [-65, 35, 15],
          [-65, 45, 25],
          [-65, 55, 35],
          [-65, 65, 45],
          [-65, 55, 55],
          [-65, 45, 65],
          [-65, 35, 75],
          [-65, 25, 85],
          [-75, 15, 5],
          [-75, 25, 15],
          [-75, 35, 25],
          [-75, 45, 35],
          [-75, 55, 45],
          [-75, 45, 55],
          [-75, 35, 65],
          [-75, 25, 75],
          [-75, 15, 85],
          [-85, 5, 5],
          [-85, 15, 15],
          [-85, 25, 25],
          [-85, 35, 35],
          [-85, 45, 45],
          [-85, 35, 55],
          [-85, 25, 65],
          [-85, 15, 75],
          [-85, 5, 85]
        ],
        "smps": ["S1", "S2", "S3"],
        "vars": ["V1", "V2", "V3", "V4", "V5", "V6", "V7", "V8", "V9", "V10", "V11", "V12", "V13", "V14", "V15", "V16", "V17", "V18", "V19", "V20", "V21", "V22", "V23", "V24", "V25", "V26", "V27", "V28", "V29", "V30", "V31", "V32", "V33", "V34", "V35", "V36", "V37", "V38", "V39", "V40", "V41", "V42", "V43", "V44", "V45", "V46", "V47", "V48", "V49", "V50", "V51", "V52", "V53", "V54", "V55", "V56", "V57", "V58", "V59", "V60", "V61", "V62", "V63", "V64", "V65", "V66", "V67", "V68", "V69", "V70", "V71", "V72", "V73", "V74", "V75", "V76", "V77", "V78", "V79", "V80", "V81"]
      }
    },
    config = {
      "graphType": "Scatter3D",
      "scatterType": "bar",
      "xAxis": ["S1"],
      "yAxis": ["S2"],
      "zAxis": ["S3"]
    },
    width = 600,
    height = 600
  )
)
using CanvasXpress

canvasxpress(Dict(
  "y" => Dict(
    "data" => [
      [-5, 5, 5],
      [-5, 15, 15],
      [-5, 25, 25],
      [-5, 35, 35],
      [-5, 45, 45],
      [-5, 35, 55],
      [-5, 25, 65],
      [-5, 15, 75],
      [-5, 5, 85],
      [-15, 15, 5],
      [-15, 25, 15],
      [-15, 35, 25],
      [-15, 45, 35],
      [-15, 55, 45],
      [-15, 45, 55],
      [-15, 35, 65],
      [-15, 25, 75],
      [-15, 15, 85],
      [-25, 25, 5],
      [-25, 35, 15],
      [-25, 45, 25],
      [-25, 55, 35],
      [-25, 65, 45],
      [-25, 55, 55],
      [-25, 45, 65],
      [-25, 35, 75],
      [-25, 25, 85],
      [-35, 35, 5],
      [-35, 45, 15],
      [-35, 55, 25],
      [-35, 65, 35],
      [-35, 75, 45],
      [-35, 65, 55],
      [-35, 55, 65],
      [-35, 45, 75],
      [-35, 35, 85],
      [-45, 45, 5],
      [-45, 55, 15],
      [-45, 65, 25],
      [-45, 75, 35],
      [-45, 85, 45],
      [-45, 75, 55],
      [-45, 65, 65],
      [-45, 55, 75],
      [-45, 45, 85],
      [-55, 35, 5],
      [-55, 45, 15],
      [-55, 55, 25],
      [-55, 65, 35],
      [-55, 75, 45],
      [-55, 65, 55],
      [-55, 55, 65],
      [-55, 45, 75],
      [-55, 35, 85],
      [-65, 25, 5],
      [-65, 35, 15],
      [-65, 45, 25],
      [-65, 55, 35],
      [-65, 65, 45],
      [-65, 55, 55],
      [-65, 45, 65],
      [-65, 35, 75],
      [-65, 25, 85],
      [-75, 15, 5],
      [-75, 25, 15],
      [-75, 35, 25],
      [-75, 45, 35],
      [-75, 55, 45],
      [-75, 45, 55],
      [-75, 35, 65],
      [-75, 25, 75],
      [-75, 15, 85],
      [-85, 5, 5],
      [-85, 15, 15],
      [-85, 25, 25],
      [-85, 35, 35],
      [-85, 45, 45],
      [-85, 35, 55],
      [-85, 25, 65],
      [-85, 15, 75],
      [-85, 5, 85]
    ],
    "smps" => ["S1", "S2", "S3"],
    "vars" => ["V1", "V2", "V3", "V4", "V5", "V6", "V7", "V8", "V9", "V10", "V11", "V12", "V13", "V14", "V15", "V16", "V17", "V18", "V19", "V20", "V21", "V22", "V23", "V24", "V25", "V26", "V27", "V28", "V29", "V30", "V31", "V32", "V33", "V34", "V35", "V36", "V37", "V38", "V39", "V40", "V41", "V42", "V43", "V44", "V45", "V46", "V47", "V48", "V49", "V50", "V51", "V52", "V53", "V54", "V55", "V56", "V57", "V58", "V59", "V60", "V61", "V62", "V63", "V64", "V65", "V66", "V67", "V68", "V69", "V70", "V71", "V72", "V73", "V74", "V75", "V76", "V77", "V78", "V79", "V80", "V81"]
  )
);
  graphType = "Scatter3D",
  scatterType = "bar",
  xAxis = ["S1"],
  yAxis = ["S2"],
  zAxis = ["S3"]
)