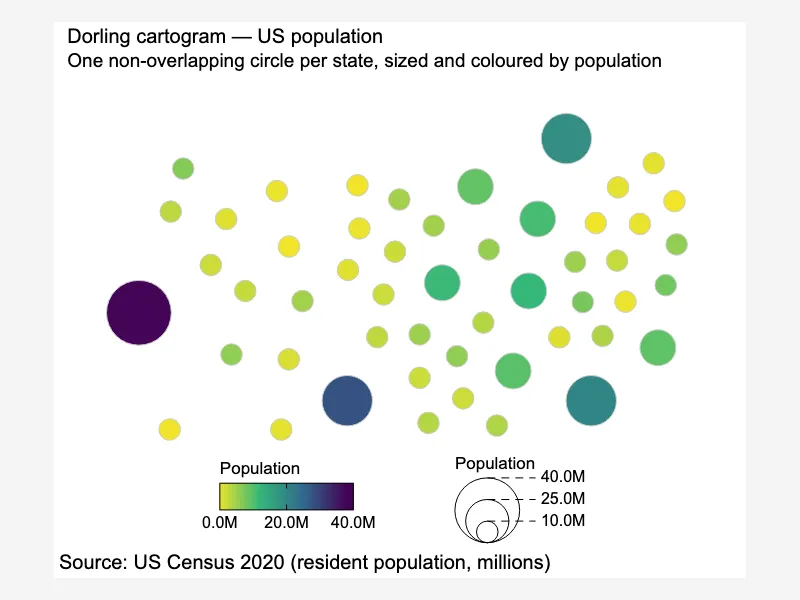
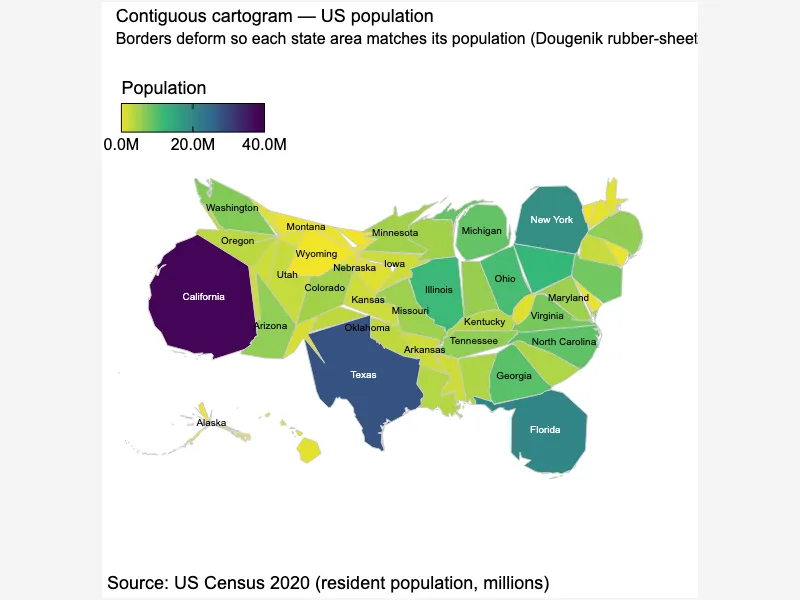
Dorling cartogram — US population
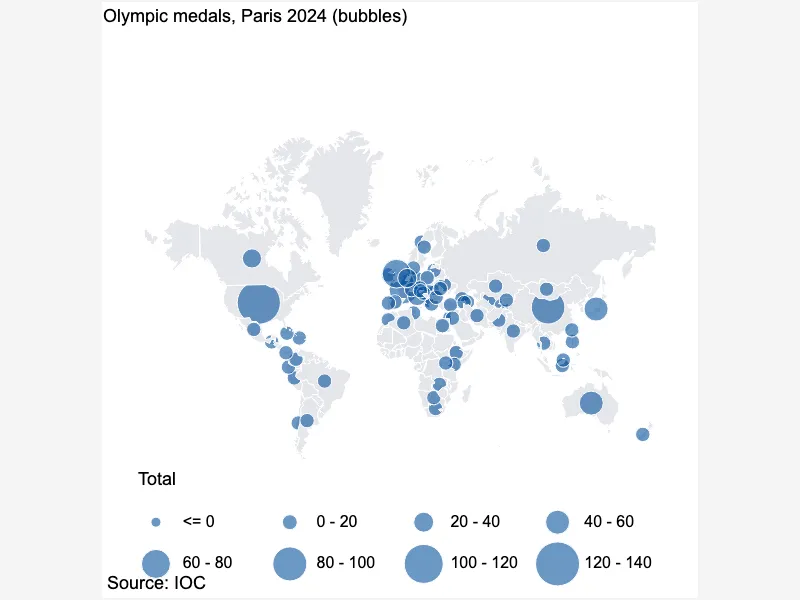
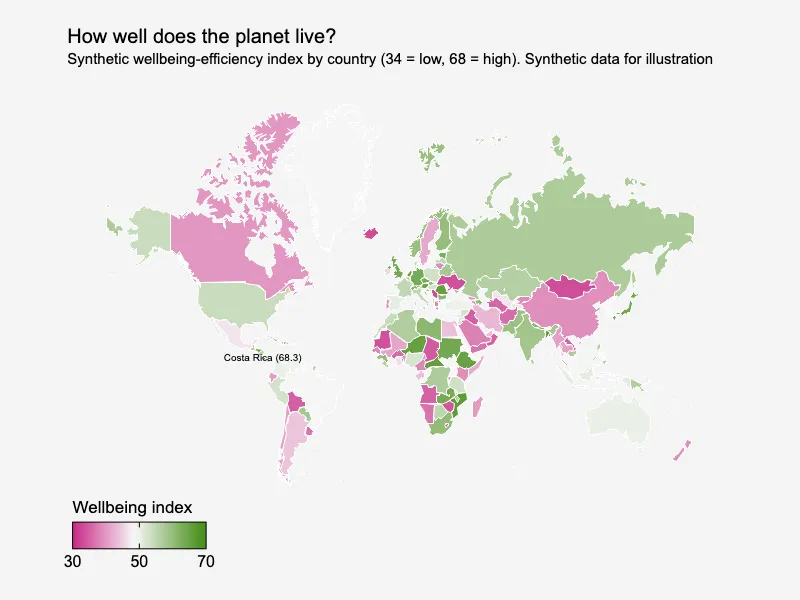
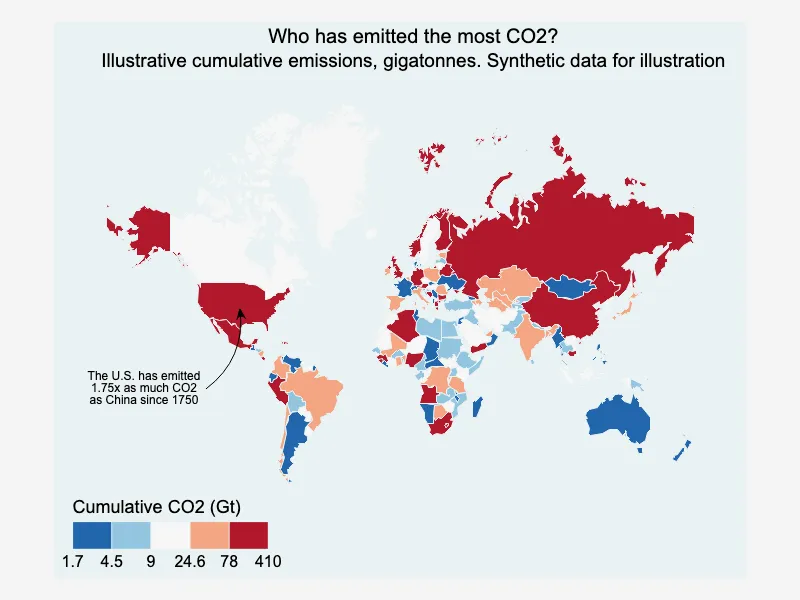
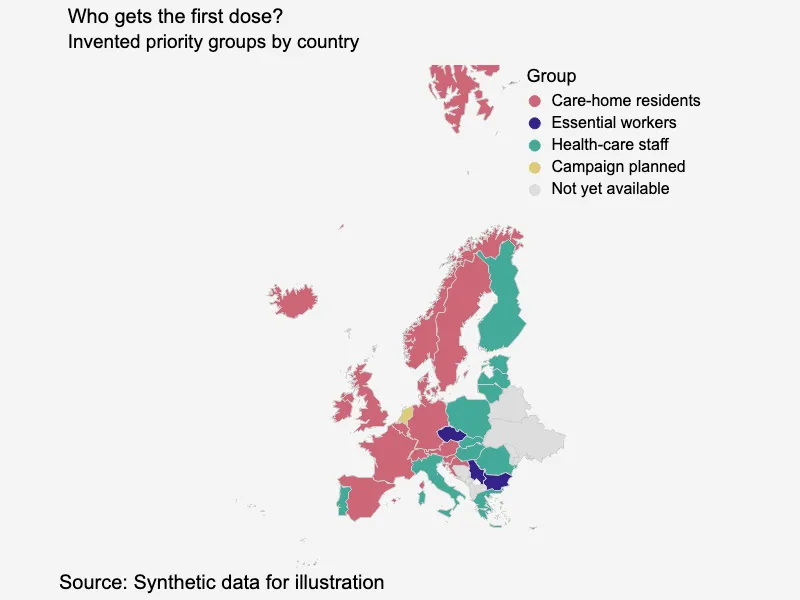
Maps in CanvasXpress allow users to create interactive and customizable visualizations for geographical data. You can integrate various map types, such as choropleths or point maps, and layer your data to highlight trends, distributions, or relationships across regions. With its flexibility, Maps in CanvasXpress support detailed analysis and presentation of spatial data for a wide range of applications.


<html>

  <head>
    <!-- Include the CanvasXpress library in your HTML file -->
    <link rel="stylesheet" href="https://www.canvasxpress.org/dist/canvasXpress.css" type="text/css"/>
    <script src="https://www.canvasxpress.org/dist/canvasXpress.min.js"></script>
  </head>

  <body>

    <!-- Create a canvas element for the chart with the desired dimensions -->
    <div>
      <canvas id="canvasId" width="600" height="600"></canvas>
    </div>


    <!-- Create a script to initialize the chart -->
    <script>

      // Use a data frame (2D-array) for the graph
      var data =

      // Create the configuration for the graph
      var config = {
         "graphType" : "Map",
         "topoJSON" : "https://www.canvasxpress.org/data/maps/USA.json",
         "mapId" : "albersStates",
         "mapProjection" : "albers",
         "mapAlbersInsets" : true,
         "theme" : "classic",
         "showMapLabels" : false,
         "legendPosition" : "bottom",
         "legendInside" : false,
         "sizeLegendNested" : true,
         "sizes" : [6, 18, 30, 42, 54, 66, 78, 90, 102, 114, 126],
         "width" : 900,
         "height" : 560,
         "legendNumberFormat" : {
            "style" : "decimal",
            "decimals" : 1,
            "suffix" : "M"
         },
         "colorSpectrum" : [
            "#fde725",
            "#35b779",
            "#31688e",
            "#440154"
         ],
         "source" : "US Census 2020 (resident population, millions)",
         "sizeBy" : "Population",
         "colorBy" : "Population",
         "mapType" : "dorling",
         "title" : "Dorling cartogram — US population",
         "subtitle" : "One non-overlapping circle per state, sized and coloured by population"
      }

      // Event used to create graph (optional)
      var events = false

      // Call the CanvasXpress function to create the graph
      var cX = new CanvasXpress("canvasId", data, config, events);

    </script>

  </body>

</html>
<html>

  <head>
    <!-- Include the CanvasXpress library in your HTML file -->
    <link rel="stylesheet" href="https://www.canvasxpress.org/dist/canvasXpress.css" type="text/css"/>
    <script src="https://www.canvasxpress.org/dist/canvasXpress.min.js"></script>
  </head>

  <body>

    <!-- Create a canvas element for the chart with the desired dimensions -->
    <div>
      <canvas id="canvasId" width="600" height="600"></canvas>
    </div>


    <!-- Create a script to initialize the chart -->
    <script>

      // Create the data for the graph
      var data = {
         "y" : {
            "vars" : [
               "AL",
               "AK",
               "AZ",
               "AR",
               "CA",
               "CO",
               "CT",
               "DE",
               "FL",
               "GA",
               "HI",
               "ID",
               "IL",
               "IN",
               "IA",
               "KS",
               "KY",
               "LA",
               "ME",
               "MD",
               "MA",
               "MI",
               "MN",
               "MS",
               "MO",
               "MT",
               "NE",
               "NV",
               "NH",
               "NJ",
               "NM",
               "NY",
               "NC",
               "ND",
               "OH",
               "OK",
               "OR",
               "PA",
               "RI",
               "SC",
               "SD",
               "TN",
               "TX",
               "UT",
               "VT",
               "VA",
               "WA",
               "WV",
               "WI",
               "WY",
               "DC"
            ],
            "smps" : [
               "Population"
            ],
            "data" : [
               [
                  5.02
               ],
               [
                  0.73
               ],
               [
                  7.15
               ],
               [
                  3.01
               ],
               [
                  39.54
               ],
               [
                  5.77
               ],
               [
                  3.61
               ],
               [
                  0.99
               ],
               [
                  21.54
               ],
               [
                  10.71
               ],
               [
                  1.46
               ],
               [
                  1.84
               ],
               [
                  12.81
               ],
               [
                  6.79
               ],
               [
                  3.19
               ],
               [
                  2.94
               ],
               [
                  4.51
               ],
               [
                  4.66
               ],
               [
                  1.36
               ],
               [
                  6.18
               ],
               [
                  7.03
               ],
               [
                  10.08
               ],
               [
                  5.71
               ],
               [
                  2.96
               ],
               [
                  6.15
               ],
               [
                  1.08
               ],
               [
                  1.96
               ],
               [
                  3.1
               ],
               [
                  1.38
               ],
               [
                  9.29
               ],
               [
                  2.12
               ],
               [
                  20.2
               ],
               [
                  10.44
               ],
               [
                  0.78
               ],
               [
                  11.8
               ],
               [
                  3.96
               ],
               [
                  4.24
               ],
               [
                  13.0
               ],
               [
                  1.1
               ],
               [
                  5.12
               ],
               [
                  0.89
               ],
               [
                  6.91
               ],
               [
                  29.15
               ],
               [
                  3.27
               ],
               [
                  0.64
               ],
               [
                  8.63
               ],
               [
                  7.71
               ],
               [
                  1.79
               ],
               [
                  5.89
               ],
               [
                  0.58
               ],
               [
                  0.69
               ]
            ]
         }
      }

      // Create the configuration for the graph
      var config = {
         "graphType" : "Map",
         "topoJSON" : "https://www.canvasxpress.org/data/maps/USA.json",
         "mapId" : "albersStates",
         "mapProjection" : "albers",
         "mapAlbersInsets" : true,
         "theme" : "classic",
         "showMapLabels" : false,
         "legendPosition" : "bottom",
         "legendInside" : false,
         "sizeLegendNested" : true,
         "sizes" : [6, 18, 30, 42, 54, 66, 78, 90, 102, 114, 126],
         "width" : 900,
         "height" : 560,
         "legendNumberFormat" : {
            "style" : "decimal",
            "decimals" : 1,
            "suffix" : "M"
         },
         "colorSpectrum" : [
            "#fde725",
            "#35b779",
            "#31688e",
            "#440154"
         ],
         "source" : "US Census 2020 (resident population, millions)",
         "sizeBy" : "Population",
         "colorBy" : "Population",
         "mapType" : "dorling",
         "title" : "Dorling cartogram — US population",
         "subtitle" : "One non-overlapping circle per state, sized and coloured by population"
      }

      // Event used to create graph (optional)
      var events = false

            // Call the CanvasXpress function to create the graph
      var cX = new CanvasXpress("canvasId", data, config, events);

    </script>

  </body>

</html>
library(canvasXpress)
y=read.table("https://www.canvasxpress.org/data/r/cX-map29-dat.txt", header=TRUE, sep="\t", quote="", row.names=1, fill=TRUE, check.names=FALSE, stringsAsFactors=FALSE)
canvasXpress(
data=y,
colorBy="Population",
colorSpectrum=list("#fde725", "#35b779", "#31688e", "#440154"),
graphType="Map",
height=560,
legendInside=FALSE,
legendNumberFormat=list(decimals=1, style="decimal", suffix="M"),
legendPosition="bottom",
mapAlbersInsets=TRUE,
mapId="albersStates",
mapProjection="albers",
mapType="dorling",
showMapLabels=FALSE,
sizeBy="Population",
sizeLegendNested=TRUE,
sizes=list(6, 18, 30, 42, 54, 66, 78, 90, 102, 114, 126),
source="US Census 2020 (resident population, millions)",
subtitle="One non-overlapping circle per state, sized and coloured by population",
theme="classic",
title="Dorling cartogram — US population",
topoJSON="https://www.canvasxpress.org/data/maps/USA.json",
width=900
)
from canvasxpress.canvas import CanvasXpress
from canvasxpress.plot import show_in_browser

if __name__ == "__main__":
  # Define the chart with its data and configuration
  chart: CanvasXpress = CanvasXpress(
    render_to = "map28",
    data = {
      "y": {
        "vars": ["AL", "AK", "AZ", "AR", "CA", "CO", "CT", "DE", "FL", "GA", "HI", "ID", "IL", "IN", "IA", "KS", "KY", "LA", "ME", "MD", "MA", "MI", "MN", "MS", "MO", "MT", "NE", "NV", "NH", "NJ", "NM", "NY", "NC", "ND", "OH", "OK", "OR", "PA", "RI", "SC", "SD", "TN", "TX", "UT", "VT", "VA", "WA", "WV", "WI", "WY", "DC"],
        "smps": ["Population"],
        "data": [
          [5.02],
          [0.73],
          [7.15],
          [3.01],
          [39.54],
          [5.77],
          [3.61],
          [0.99],
          [21.54],
          [10.71],
          [1.46],
          [1.84],
          [12.81],
          [6.79],
          [3.19],
          [2.94],
          [4.51],
          [4.66],
          [1.36],
          [6.18],
          [7.03],
          [10.08],
          [5.71],
          [2.96],
          [6.15],
          [1.08],
          [1.96],
          [3.1],
          [1.38],
          [9.29],
          [2.12],
          [20.2],
          [10.44],
          [0.78],
          [11.8],
          [3.96],
          [4.24],
          [13.0],
          [1.1],
          [5.12],
          [0.89],
          [6.91],
          [29.15],
          [3.27],
          [0.64],
          [8.63],
          [7.71],
          [1.79],
          [5.89],
          [0.58],
          [0.69]
        ]
      }
    },
    config = {
      "graphType": "Map",
      "topoJSON": "https://www.canvasxpress.org/data/maps/USA.json",
      "mapId": "albersStates",
      "mapProjection": "albers",
      "mapAlbersInsets": True,
      "theme": "classic",
      "showMapLabels": False,
      "legendPosition": "bottom",
      "legendInside": False,
      "sizeLegendNested": True,
      "sizes": [6, 18, 30, 42, 54, 66, 78, 90, 102, 114, 126],
      "width": 900,
      "height": 560,
      "legendNumberFormat": {
        "style": "decimal",
        "decimals": 1,
        "suffix": "M"
      },
      "colorSpectrum": ["#fde725", "#35b779", "#31688e", "#440154"],
      "source": "US Census 2020 (resident population, millions)",
      "sizeBy": "Population",
      "colorBy": "Population",
      "mapType": "dorling",
      "title": "Dorling cartogram — US population",
      "subtitle": "One non-overlapping circle per state, sized and coloured by population"
    },
    width = 900,
    height = 560
  )

  # Display the chart in its own Web page
  show_in_browser(chart)
Run this notebook:

from canvasxpress.canvas import CanvasXpress
from canvasxpress.plot import graph

graph(
  CanvasXpress(
    render_to = "map28",
    data = {
      "y": {
        "vars": ["AL", "AK", "AZ", "AR", "CA", "CO", "CT", "DE", "FL", "GA", "HI", "ID", "IL", "IN", "IA", "KS", "KY", "LA", "ME", "MD", "MA", "MI", "MN", "MS", "MO", "MT", "NE", "NV", "NH", "NJ", "NM", "NY", "NC", "ND", "OH", "OK", "OR", "PA", "RI", "SC", "SD", "TN", "TX", "UT", "VT", "VA", "WA", "WV", "WI", "WY", "DC"],
        "smps": ["Population"],
        "data": [
          [5.02],
          [0.73],
          [7.15],
          [3.01],
          [39.54],
          [5.77],
          [3.61],
          [0.99],
          [21.54],
          [10.71],
          [1.46],
          [1.84],
          [12.81],
          [6.79],
          [3.19],
          [2.94],
          [4.51],
          [4.66],
          [1.36],
          [6.18],
          [7.03],
          [10.08],
          [5.71],
          [2.96],
          [6.15],
          [1.08],
          [1.96],
          [3.1],
          [1.38],
          [9.29],
          [2.12],
          [20.2],
          [10.44],
          [0.78],
          [11.8],
          [3.96],
          [4.24],
          [13.0],
          [1.1],
          [5.12],
          [0.89],
          [6.91],
          [29.15],
          [3.27],
          [0.64],
          [8.63],
          [7.71],
          [1.79],
          [5.89],
          [0.58],
          [0.69]
        ]
      }
    },
    config = {
      "graphType": "Map",
      "topoJSON": "https://www.canvasxpress.org/data/maps/USA.json",
      "mapId": "albersStates",
      "mapProjection": "albers",
      "mapAlbersInsets": True,
      "theme": "classic",
      "showMapLabels": False,
      "legendPosition": "bottom",
      "legendInside": False,
      "sizeLegendNested": True,
      "sizes": [6, 18, 30, 42, 54, 66, 78, 90, 102, 114, 126],
      "width": 900,
      "height": 560,
      "legendNumberFormat": {
        "style": "decimal",
        "decimals": 1,
        "suffix": "M"
      },
      "colorSpectrum": ["#fde725", "#35b779", "#31688e", "#440154"],
      "source": "US Census 2020 (resident population, millions)",
      "sizeBy": "Population",
      "colorBy": "Population",
      "mapType": "dorling",
      "title": "Dorling cartogram — US population",
      "subtitle": "One non-overlapping circle per state, sized and coloured by population"
    },
    width = 900,
    height = 560
  )
)
using CanvasXpress

canvasxpress(Dict(
  "y" => Dict(
    "vars" => ["AL", "AK", "AZ", "AR", "CA", "CO", "CT", "DE", "FL", "GA", "HI", "ID", "IL", "IN", "IA", "KS", "KY", "LA", "ME", "MD", "MA", "MI", "MN", "MS", "MO", "MT", "NE", "NV", "NH", "NJ", "NM", "NY", "NC", "ND", "OH", "OK", "OR", "PA", "RI", "SC", "SD", "TN", "TX", "UT", "VT", "VA", "WA", "WV", "WI", "WY", "DC"],
    "smps" => ["Population"],
    "data" => [
      [5.02],
      [0.73],
      [7.15],
      [3.01],
      [39.54],
      [5.77],
      [3.61],
      [0.99],
      [21.54],
      [10.71],
      [1.46],
      [1.84],
      [12.81],
      [6.79],
      [3.19],
      [2.94],
      [4.51],
      [4.66],
      [1.36],
      [6.18],
      [7.03],
      [10.08],
      [5.71],
      [2.96],
      [6.15],
      [1.08],
      [1.96],
      [3.1],
      [1.38],
      [9.29],
      [2.12],
      [20.2],
      [10.44],
      [0.78],
      [11.8],
      [3.96],
      [4.24],
      [13.0],
      [1.1],
      [5.12],
      [0.89],
      [6.91],
      [29.15],
      [3.27],
      [0.64],
      [8.63],
      [7.71],
      [1.79],
      [5.89],
      [0.58],
      [0.69]
    ]
  )
);
  graphType = "Map",
  topoJSON = "https://www.canvasxpress.org/data/maps/USA.json",
  mapId = "albersStates",
  mapProjection = "albers",
  mapAlbersInsets = true,
  theme = "classic",
  showMapLabels = false,
  legendPosition = "bottom",
  legendInside = false,
  sizeLegendNested = true,
  sizes = [6, 18, 30, 42, 54, 66, 78, 90, 102, 114, 126],
  width = 900,
  height = 560,
  legendNumberFormat = Dict(
    "style" => "decimal",
    "decimals" => 1,
    "suffix" => "M"
  ),
  colorSpectrum = ["#fde725", "#35b779", "#31688e", "#440154"],
  source = "US Census 2020 (resident population, millions)",
  sizeBy = "Population",
  colorBy = "Population",
  mapType = "dorling",
  title = "Dorling cartogram — US population",
  subtitle = "One non-overlapping circle per state, sized and coloured by population"
)