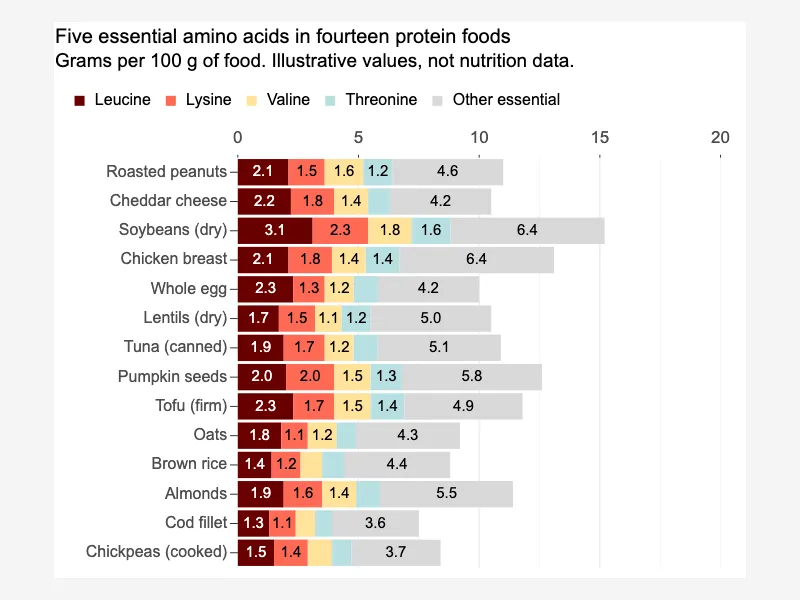
Fourteen foods, five stacked components
Stacked bar graphs are a type of bar chart that visually represent data by stacking different components of a dataset on top of one another within a single bar. Each segment of the bar represents a category or portion of the total, making it easy to compare both the overall totals and the individual parts across multiple groups.


<html>

  <head>
    <!-- Include the CanvasXpress library in your HTML file -->
    <link rel="stylesheet" href="https://www.canvasxpress.org/dist/canvasXpress.css" type="text/css"/>
    <script src="https://www.canvasxpress.org/dist/canvasXpress.min.js"></script>
  </head>

  <body>

    <!-- Create a canvas element for the chart with the desired dimensions -->
    <div>
      <canvas id="canvasId" width="600" height="600"></canvas>
    </div>


    <!-- Create a script to initialize the chart -->
    <script>

      // Use a data frame (2D-array) for the graph
      var data =

      // Create the configuration for the graph
      var config = {
         "graphType" : "Stacked",
         "titleAlign" : "plot::0",
         "subtitleAlign" : "plot::0",
         "legendHorizontalJustification" : 0,
         "legendJustifyTo" : "plot",
         "graphOrientation" : "horizontal",
         "theme" : "bw",
         "colorScheme" : "User",
         "colors" : [
            "#6A0000",
            "#FF6A55",
            "#FFE29B",
            "#B8E0E2",
            "#D9D9D9"
         ],
         "xAxis" : [
            "Leucine",
            "Lysine",
            "Valine",
            "Threonine",
            "Other essential"
         ],
         "title" : "Five essential amino acids in fourteen protein foods",
         "subtitle" : "Grams per 100 g of food. Illustrative values, not nutrition data.",
         "showDataValues" : true,
         "dataValuesPosition" : "inside",
         "dataValuesHideOverlap" : true,
         "dataTextColor" : "auto",
         "dataTextScaleFontFactor" : 0.8,
         "dataLabelNumberFormat" : "%.1f",
         "legendPosition" : "top",
         "showLegend" : true,
         "xAxisTitle" : "",
         "sampleSpaceFactor" : 0.3,
         "smpTitle" : ""
      }

      // Event used to create graph (optional)
      var events = false

      // Call the CanvasXpress function to create the graph
      var cX = new CanvasXpress("canvasId", data, config, events);

    </script>

  </body>

</html>
<html>

  <head>
    <!-- Include the CanvasXpress library in your HTML file -->
    <link rel="stylesheet" href="https://www.canvasxpress.org/dist/canvasXpress.css" type="text/css"/>
    <script src="https://www.canvasxpress.org/dist/canvasXpress.min.js"></script>
  </head>

  <body>

    <!-- Create a canvas element for the chart with the desired dimensions -->
    <div>
      <canvas id="canvasId" width="600" height="600"></canvas>
    </div>


    <!-- Create a script to initialize the chart -->
    <script>

      // Create the data for the graph
      var data = {
         "y" : {
            "vars" : [
               "Leucine",
               "Lysine",
               "Valine",
               "Threonine",
               "Other essential"
            ],
            "smps" : [
               "Roasted peanuts",
               "Cheddar cheese",
               "Soybeans (dry)",
               "Chicken breast",
               "Whole egg",
               "Lentils (dry)",
               "Tuna (canned)",
               "Pumpkin seeds",
               "Tofu (firm)",
               "Oats",
               "Brown rice",
               "Almonds",
               "Cod fillet",
               "Chickpeas (cooked)"
            ],
            "data" : [
               [
                  2.1,
                  2.2,
                  3.1,
                  2.1,
                  2.3,
                  1.7,
                  1.9,
                  2,
                  2.3,
                  1.8,
                  1.4,
                  1.9,
                  1.3,
                  1.5
               ],
               [
                  1.5,
                  1.8,
                  2.3,
                  1.8,
                  1.3,
                  1.5,
                  1.7,
                  2,
                  1.7,
                  1.1,
                  1.2,
                  1.6,
                  1.1,
                  1.4
               ],
               [
                  1.6,
                  1.4,
                  1.8,
                  1.4,
                  1.2,
                  1.1,
                  1.2,
                  1.5,
                  1.5,
                  1.2,
                  0.9,
                  1.4,
                  0.8,
                  1
               ],
               [
                  1.2,
                  0.9,
                  1.6,
                  1.4,
                  1,
                  1.2,
                  1,
                  1.3,
                  1.4,
                  0.8,
                  0.9,
                  1,
                  0.7,
                  0.8
               ],
               [
                  4.6,
                  4.2,
                  6.4,
                  6.4,
                  4.2,
                  5,
                  5.1,
                  5.8,
                  4.9,
                  4.3,
                  4.4,
                  5.5,
                  3.6,
                  3.7
               ]
            ]
         }
      }

      // Create the configuration for the graph
      var config = {
         "graphType" : "Stacked",
         "titleAlign" : "plot::0",
         "subtitleAlign" : "plot::0",
         "legendHorizontalJustification" : 0,
         "legendJustifyTo" : "plot",
         "graphOrientation" : "horizontal",
         "theme" : "bw",
         "colorScheme" : "User",
         "colors" : [
            "#6A0000",
            "#FF6A55",
            "#FFE29B",
            "#B8E0E2",
            "#D9D9D9"
         ],
         "xAxis" : [
            "Leucine",
            "Lysine",
            "Valine",
            "Threonine",
            "Other essential"
         ],
         "title" : "Five essential amino acids in fourteen protein foods",
         "subtitle" : "Grams per 100 g of food. Illustrative values, not nutrition data.",
         "showDataValues" : true,
         "dataValuesPosition" : "inside",
         "dataValuesHideOverlap" : true,
         "dataTextColor" : "auto",
         "dataTextScaleFontFactor" : 0.8,
         "dataLabelNumberFormat" : "%.1f",
         "legendPosition" : "top",
         "showLegend" : true,
         "xAxisTitle" : "",
         "sampleSpaceFactor" : 0.3,
         "smpTitle" : ""
      }

      // Event used to create graph (optional)
      var events = false

            // Call the CanvasXpress function to create the graph
      var cX = new CanvasXpress("canvasId", data, config, events);

    </script>

  </body>

</html>
library(canvasXpress)
y=read.table("https://www.canvasxpress.org/data/r/cX-stacked8-dat.txt", header=TRUE, sep="\t", quote="", row.names=1, fill=TRUE, check.names=FALSE, stringsAsFactors=FALSE)
canvasXpress(
data=y,
colorScheme="User",
colors=list("#6A0000", "#FF6A55", "#FFE29B", "#B8E0E2", "#D9D9D9"),
dataLabelNumberFormat="%.1f",
dataTextColor="auto",
dataTextScaleFontFactor=0.8,
dataValuesHideOverlap=TRUE,
dataValuesPosition="inside",
graphOrientation="horizontal",
graphType="Stacked",
legendHorizontalJustification=0,
legendJustifyTo="plot",
legendPosition="top",
sampleSpaceFactor=0.3,
showDataValues=TRUE,
showLegend=TRUE,
smpTitle="",
subtitle="Grams per 100 g of food. Illustrative values, not nutrition data.",
subtitleAlign="plot::0",
theme="bw",
title="Five essential amino acids in fourteen protein foods",
titleAlign="plot::0",
xAxis=list("Leucine", "Lysine", "Valine", "Threonine", "Other essential"),
xAxisTitle=""
)
from canvasxpress.canvas import CanvasXpress
from canvasxpress.plot import show_in_browser

if __name__ == "__main__":
  # Define the chart with its data and configuration
  chart: CanvasXpress = CanvasXpress(
    render_to = "stacked8",
    data = {
      "y": {
        "vars": ["Leucine", "Lysine", "Valine", "Threonine", "Other essential"],
        "smps": ["Roasted peanuts", "Cheddar cheese", "Soybeans (dry)", "Chicken breast", "Whole egg", "Lentils (dry)", "Tuna (canned)", "Pumpkin seeds", "Tofu (firm)", "Oats", "Brown rice", "Almonds", "Cod fillet", "Chickpeas (cooked)"],
        "data": [
          [2.1, 2.2, 3.1, 2.1, 2.3, 1.7, 1.9, 2, 2.3, 1.8, 1.4, 1.9, 1.3, 1.5],
          [1.5, 1.8, 2.3, 1.8, 1.3, 1.5, 1.7, 2, 1.7, 1.1, 1.2, 1.6, 1.1, 1.4],
          [1.6, 1.4, 1.8, 1.4, 1.2, 1.1, 1.2, 1.5, 1.5, 1.2, 0.9, 1.4, 0.8, 1],
          [1.2, 0.9, 1.6, 1.4, 1, 1.2, 1, 1.3, 1.4, 0.8, 0.9, 1, 0.7, 0.8],
          [4.6, 4.2, 6.4, 6.4, 4.2, 5, 5.1, 5.8, 4.9, 4.3, 4.4, 5.5, 3.6, 3.7]
        ]
      }
    },
    config = {
      "graphType": "Stacked",
      "titleAlign": "plot::0",
      "subtitleAlign": "plot::0",
      "legendHorizontalJustification": 0,
      "legendJustifyTo": "plot",
      "graphOrientation": "horizontal",
      "theme": "bw",
      "colorScheme": "User",
      "colors": ["#6A0000", "#FF6A55", "#FFE29B", "#B8E0E2", "#D9D9D9"],
      "xAxis": ["Leucine", "Lysine", "Valine", "Threonine", "Other essential"],
      "title": "Five essential amino acids in fourteen protein foods",
      "subtitle": "Grams per 100 g of food. Illustrative values, not nutrition data.",
      "showDataValues": True,
      "dataValuesPosition": "inside",
      "dataValuesHideOverlap": True,
      "dataTextColor": "auto",
      "dataTextScaleFontFactor": 0.8,
      "dataLabelNumberFormat": "%.1f",
      "legendPosition": "top",
      "showLegend": True,
      "xAxisTitle": "",
      "sampleSpaceFactor": 0.3,
      "smpTitle": ""
    },
    width = 760,
    height = 560
  )

  # Display the chart in its own Web page
  show_in_browser(chart)
Run this notebook:

from canvasxpress.canvas import CanvasXpress
from canvasxpress.plot import graph

graph(
  CanvasXpress(
    render_to = "stacked8",
    data = {
      "y": {
        "vars": ["Leucine", "Lysine", "Valine", "Threonine", "Other essential"],
        "smps": ["Roasted peanuts", "Cheddar cheese", "Soybeans (dry)", "Chicken breast", "Whole egg", "Lentils (dry)", "Tuna (canned)", "Pumpkin seeds", "Tofu (firm)", "Oats", "Brown rice", "Almonds", "Cod fillet", "Chickpeas (cooked)"],
        "data": [
          [2.1, 2.2, 3.1, 2.1, 2.3, 1.7, 1.9, 2, 2.3, 1.8, 1.4, 1.9, 1.3, 1.5],
          [1.5, 1.8, 2.3, 1.8, 1.3, 1.5, 1.7, 2, 1.7, 1.1, 1.2, 1.6, 1.1, 1.4],
          [1.6, 1.4, 1.8, 1.4, 1.2, 1.1, 1.2, 1.5, 1.5, 1.2, 0.9, 1.4, 0.8, 1],
          [1.2, 0.9, 1.6, 1.4, 1, 1.2, 1, 1.3, 1.4, 0.8, 0.9, 1, 0.7, 0.8],
          [4.6, 4.2, 6.4, 6.4, 4.2, 5, 5.1, 5.8, 4.9, 4.3, 4.4, 5.5, 3.6, 3.7]
        ]
      }
    },
    config = {
      "graphType": "Stacked",
      "titleAlign": "plot::0",
      "subtitleAlign": "plot::0",
      "legendHorizontalJustification": 0,
      "legendJustifyTo": "plot",
      "graphOrientation": "horizontal",
      "theme": "bw",
      "colorScheme": "User",
      "colors": ["#6A0000", "#FF6A55", "#FFE29B", "#B8E0E2", "#D9D9D9"],
      "xAxis": ["Leucine", "Lysine", "Valine", "Threonine", "Other essential"],
      "title": "Five essential amino acids in fourteen protein foods",
      "subtitle": "Grams per 100 g of food. Illustrative values, not nutrition data.",
      "showDataValues": True,
      "dataValuesPosition": "inside",
      "dataValuesHideOverlap": True,
      "dataTextColor": "auto",
      "dataTextScaleFontFactor": 0.8,
      "dataLabelNumberFormat": "%.1f",
      "legendPosition": "top",
      "showLegend": True,
      "xAxisTitle": "",
      "sampleSpaceFactor": 0.3,
      "smpTitle": ""
    },
    width = 760,
    height = 560
  )
)
using CanvasXpress

canvasxpress(Dict(
  "y" => Dict(
    "vars" => ["Leucine", "Lysine", "Valine", "Threonine", "Other essential"],
    "smps" => ["Roasted peanuts", "Cheddar cheese", "Soybeans (dry)", "Chicken breast", "Whole egg", "Lentils (dry)", "Tuna (canned)", "Pumpkin seeds", "Tofu (firm)", "Oats", "Brown rice", "Almonds", "Cod fillet", "Chickpeas (cooked)"],
    "data" => [
      [2.1, 2.2, 3.1, 2.1, 2.3, 1.7, 1.9, 2, 2.3, 1.8, 1.4, 1.9, 1.3, 1.5],
      [1.5, 1.8, 2.3, 1.8, 1.3, 1.5, 1.7, 2, 1.7, 1.1, 1.2, 1.6, 1.1, 1.4],
      [1.6, 1.4, 1.8, 1.4, 1.2, 1.1, 1.2, 1.5, 1.5, 1.2, 0.9, 1.4, 0.8, 1],
      [1.2, 0.9, 1.6, 1.4, 1, 1.2, 1, 1.3, 1.4, 0.8, 0.9, 1, 0.7, 0.8],
      [4.6, 4.2, 6.4, 6.4, 4.2, 5, 5.1, 5.8, 4.9, 4.3, 4.4, 5.5, 3.6, 3.7]
    ]
  )
);
  graphType = "Stacked",
  titleAlign = "plot::0",
  subtitleAlign = "plot::0",
  legendHorizontalJustification = 0,
  legendJustifyTo = "plot",
  graphOrientation = "horizontal",
  theme = "bw",
  colorScheme = "User",
  colors = ["#6A0000", "#FF6A55", "#FFE29B", "#B8E0E2", "#D9D9D9"],
  xAxis = ["Leucine", "Lysine", "Valine", "Threonine", "Other essential"],
  title = "Five essential amino acids in fourteen protein foods",
  subtitle = "Grams per 100 g of food. Illustrative values, not nutrition data.",
  showDataValues = true,
  dataValuesPosition = "inside",
  dataValuesHideOverlap = true,
  dataTextColor = "auto",
  dataTextScaleFontFactor = 0.8,
  dataLabelNumberFormat = "%.1f",
  legendPosition = "top",
  showLegend = true,
  xAxisTitle = "",
  sampleSpaceFactor = 0.3,
  smpTitle = ""
)