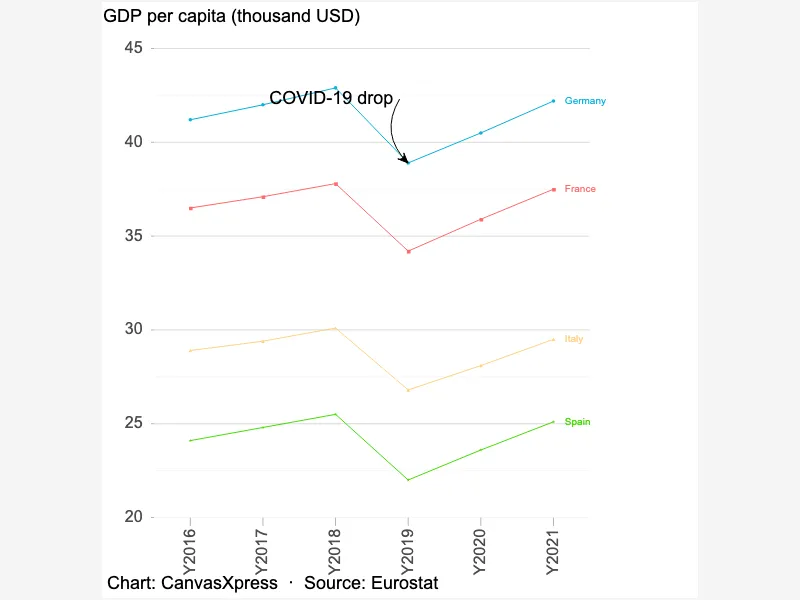
Annotated Line with Direct Labels
Line graphs are visual representations of data points connected by line segments. They effectively showcase trends and changes over time or across different categories. Ideal for displaying continuous data, line graphs highlight patterns and correlations, making complex information easily digestible. Creating effective line graphs involves careful consideration of axis labels, scales, and legends. Clear and concise titles are essential for quick understanding. Multiple datasets can be compared on a single graph, enhancing visual analysis and facilitating insightful conclusions.


<html>

  <head>
    <!-- Include the CanvasXpress library in your HTML file -->
    <link rel="stylesheet" href="https://www.canvasxpress.org/dist/canvasXpress.css" type="text/css"/>
    <script src="https://www.canvasxpress.org/dist/canvasXpress.min.js"></script>
  </head>

  <body>

    <!-- Create a canvas element for the chart with the desired dimensions -->
    <div>
      <canvas id="canvasId" width="600" height="600"></canvas>
    </div>


    <!-- Create a script to initialize the chart -->
    <script>

      // Use a data frame (2D-array) for the graph
      var data =

      // Create the configuration for the graph
      var config = {
         "graphType" : "Line",
         "graphOrientation" : "vertical",
         "title" : "GDP per capita (thousand USD)",
         "a11yDescription" : "GDP per capita fell in all four countries in 2019 and had recovered by 2021. Germany stays highest (42.2 thousand USD in 2021) and Spain lowest (25.1).",
         "showLineEndLabels" : true,
         "decorations" : {
            "marker" : [
               {
                  "text" : "COVID-19 drop",
                  "variable" : "Germany",
                  "sample" : "Y2019",
                  "type" : "curved",
                  "x" : 0.42,
                  "y" : 0.12
               }
            ]
         },
         "source" : "Eurostat",
         "byline" : "Chart: CanvasXpress"
      }

      // Event used to create graph (optional)
      var events = false

      // Call the CanvasXpress function to create the graph
      var cX = new CanvasXpress("canvasId", data, config, events);

    </script>

  </body>

</html>
<html>

  <head>
    <!-- Include the CanvasXpress library in your HTML file -->
    <link rel="stylesheet" href="https://www.canvasxpress.org/dist/canvasXpress.css" type="text/css"/>
    <script src="https://www.canvasxpress.org/dist/canvasXpress.min.js"></script>
  </head>

  <body>

    <!-- Create a canvas element for the chart with the desired dimensions -->
    <div>
      <canvas id="canvasId" width="600" height="600"></canvas>
    </div>


    <!-- Create a script to initialize the chart -->
    <script>

      // Create the data for the graph
      var data = {
         "y" : {
            "vars" : [
               "Germany",
               "France",
               "Italy",
               "Spain"
            ],
            "smps" : [
               "Y2016",
               "Y2017",
               "Y2018",
               "Y2019",
               "Y2020",
               "Y2021"
            ],
            "data" : [
               [
                  41.2,
                  42.0,
                  42.9,
                  38.9,
                  40.5,
                  42.2
               ],
               [
                  36.5,
                  37.1,
                  37.8,
                  34.2,
                  35.9,
                  37.5
               ],
               [
                  28.9,
                  29.4,
                  30.1,
                  26.8,
                  28.1,
                  29.5
               ],
               [
                  24.1,
                  24.8,
                  25.5,
                  22.0,
                  23.6,
                  25.1
               ]
            ]
         }
      }

      // Create the configuration for the graph
      var config = {
         "graphType" : "Line",
         "graphOrientation" : "vertical",
         "title" : "GDP per capita (thousand USD)",
         "a11yDescription" : "GDP per capita fell in all four countries in 2019 and had recovered by 2021. Germany stays highest (42.2 thousand USD in 2021) and Spain lowest (25.1).",
         "showLineEndLabels" : true,
         "decorations" : {
            "marker" : [
               {
                  "text" : "COVID-19 drop",
                  "variable" : "Germany",
                  "sample" : "Y2019",
                  "type" : "curved",
                  "x" : 0.42,
                  "y" : 0.12
               }
            ]
         },
         "source" : "Eurostat",
         "byline" : "Chart: CanvasXpress"
      }

      // Event used to create graph (optional)
      var events = false

            // Call the CanvasXpress function to create the graph
      var cX = new CanvasXpress("canvasId", data, config, events);

    </script>

  </body>

</html>
library(canvasXpress)
y=read.table("https://www.canvasxpress.org/data/r/cX-line7-dat.txt", header=TRUE, sep="\t", quote="", row.names=1, fill=TRUE, check.names=FALSE, stringsAsFactors=FALSE)
canvasXpress(
data=y,
a11yDescription="GDP per capita fell in all four countries in 2019 and had recovered by 2021. Germany stays highest (42.2 thousand USD in 2021) and Spain lowest (25.1).",
byline="Chart: CanvasXpress",
decorations=list(marker=list(list(sample="Y2019", text="COVID-19 drop", type="curved", variable="Germany", x=0.42, y=0.12))),
graphOrientation="vertical",
graphType="Line",
showLineEndLabels=TRUE,
source="Eurostat",
title="GDP per capita (thousand USD)"
)
from canvasxpress.canvas import CanvasXpress
from canvasxpress.plot import show_in_browser

if __name__ == "__main__":
  # Define the chart with its data and configuration
  chart: CanvasXpress = CanvasXpress(
    render_to = "line7",
    data = {
      "y": {
        "vars": ["Germany", "France", "Italy", "Spain"],
        "smps": ["Y2016", "Y2017", "Y2018", "Y2019", "Y2020", "Y2021"],
        "data": [
          [41.2, 42.0, 42.9, 38.9, 40.5, 42.2],
          [36.5, 37.1, 37.8, 34.2, 35.9, 37.5],
          [28.9, 29.4, 30.1, 26.8, 28.1, 29.5],
          [24.1, 24.8, 25.5, 22.0, 23.6, 25.1]
        ]
      }
    },
    config = {
      "graphType": "Line",
      "graphOrientation": "vertical",
      "title": "GDP per capita (thousand USD)",
      "a11yDescription": "GDP per capita fell in all four countries in 2019 and had recovered by 2021. Germany stays highest (42.2 thousand USD in 2021) and Spain lowest (25.1).",
      "showLineEndLabels": True,
      "decorations": {
        "marker": [
          {
            "text": "COVID-19 drop",
            "variable": "Germany",
            "sample": "Y2019",
            "type": "curved",
            "x": 0.42,
            "y": 0.12
          }
        ]
      },
      "source": "Eurostat",
      "byline": "Chart: CanvasXpress"
    },
    width = 600,
    height = 600
  )

  # Display the chart in its own Web page
  show_in_browser(chart)
Run this notebook:

from canvasxpress.canvas import CanvasXpress
from canvasxpress.plot import graph

graph(
  CanvasXpress(
    render_to = "line7",
    data = {
      "y": {
        "vars": ["Germany", "France", "Italy", "Spain"],
        "smps": ["Y2016", "Y2017", "Y2018", "Y2019", "Y2020", "Y2021"],
        "data": [
          [41.2, 42.0, 42.9, 38.9, 40.5, 42.2],
          [36.5, 37.1, 37.8, 34.2, 35.9, 37.5],
          [28.9, 29.4, 30.1, 26.8, 28.1, 29.5],
          [24.1, 24.8, 25.5, 22.0, 23.6, 25.1]
        ]
      }
    },
    config = {
      "graphType": "Line",
      "graphOrientation": "vertical",
      "title": "GDP per capita (thousand USD)",
      "a11yDescription": "GDP per capita fell in all four countries in 2019 and had recovered by 2021. Germany stays highest (42.2 thousand USD in 2021) and Spain lowest (25.1).",
      "showLineEndLabels": True,
      "decorations": {
        "marker": [
          {
            "text": "COVID-19 drop",
            "variable": "Germany",
            "sample": "Y2019",
            "type": "curved",
            "x": 0.42,
            "y": 0.12
          }
        ]
      },
      "source": "Eurostat",
      "byline": "Chart: CanvasXpress"
    },
    width = 600,
    height = 600
  )
)
using CanvasXpress

canvasxpress(Dict(
  "y" => Dict(
    "vars" => ["Germany", "France", "Italy", "Spain"],
    "smps" => ["Y2016", "Y2017", "Y2018", "Y2019", "Y2020", "Y2021"],
    "data" => [
      [41.2, 42.0, 42.9, 38.9, 40.5, 42.2],
      [36.5, 37.1, 37.8, 34.2, 35.9, 37.5],
      [28.9, 29.4, 30.1, 26.8, 28.1, 29.5],
      [24.1, 24.8, 25.5, 22.0, 23.6, 25.1]
    ]
  )
);
  graphType = "Line",
  graphOrientation = "vertical",
  title = "GDP per capita (thousand USD)",
  a11yDescription = "GDP per capita fell in all four countries in 2019 and had recovered by 2021. Germany stays highest (42.2 thousand USD in 2021) and Spain lowest (25.1).",
  showLineEndLabels = true,
  decorations = Dict(
    "marker" => [
      Dict(
        "text" => "COVID-19 drop",
        "variable" => "Germany",
        "sample" => "Y2019",
        "type" => "curved",
        "x" => 0.42,
        "y" => 0.12
      )
    ]
  ),
  source = "Eurostat",
  byline = "Chart: CanvasXpress"
)