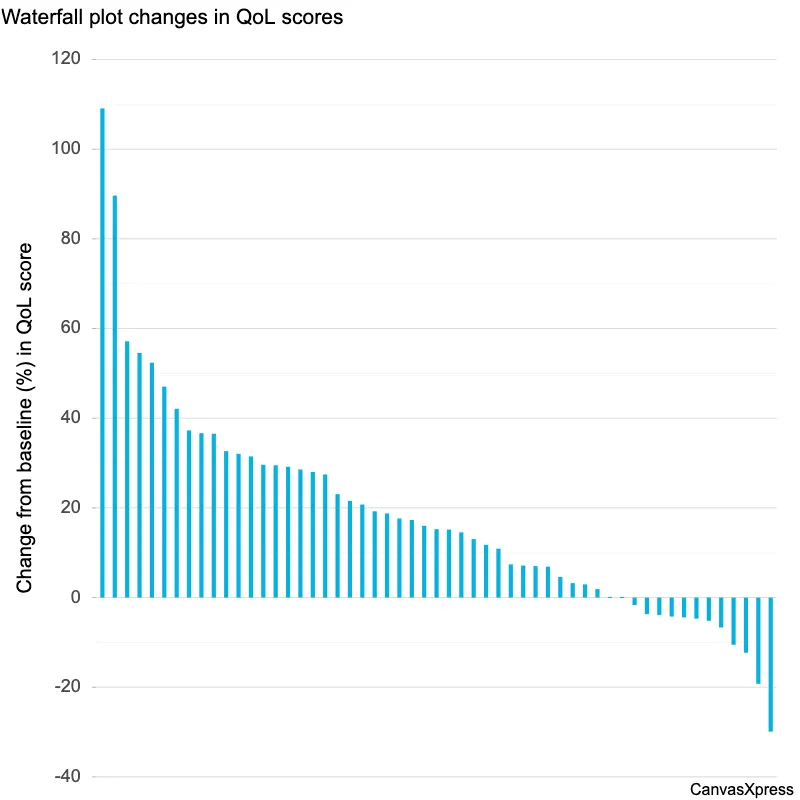
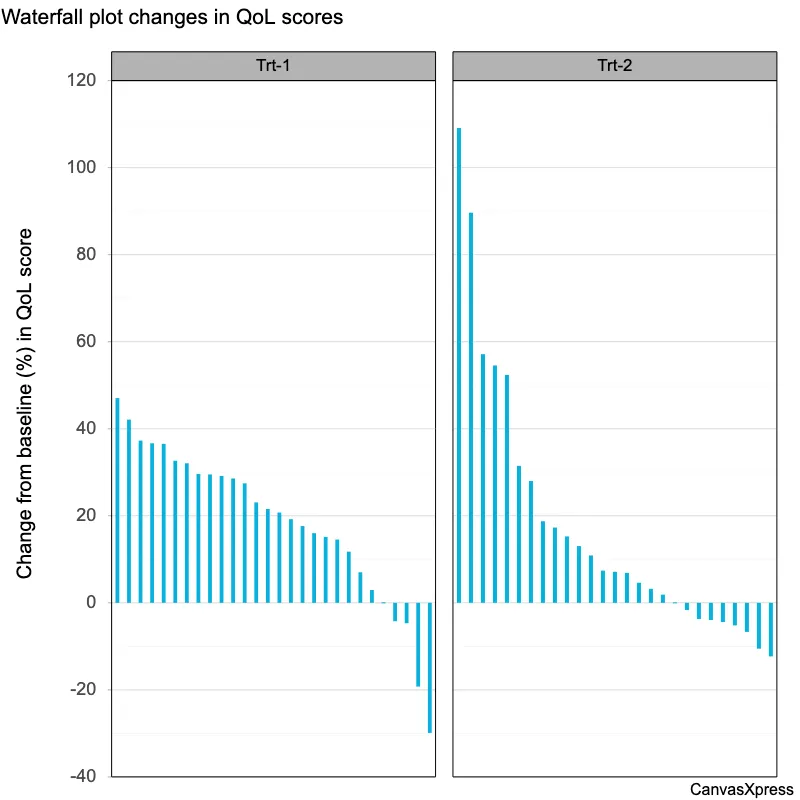
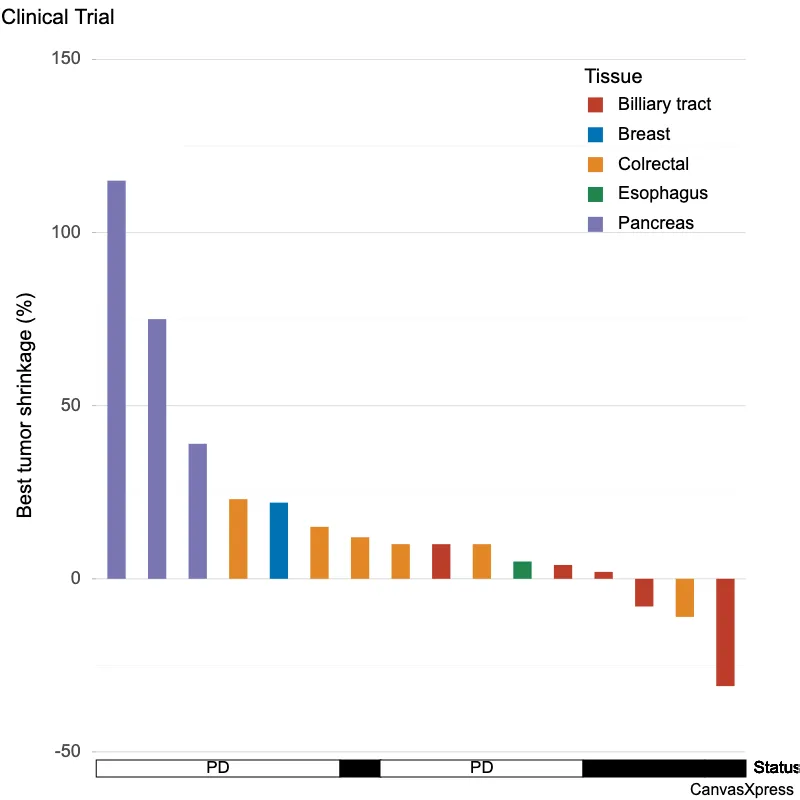
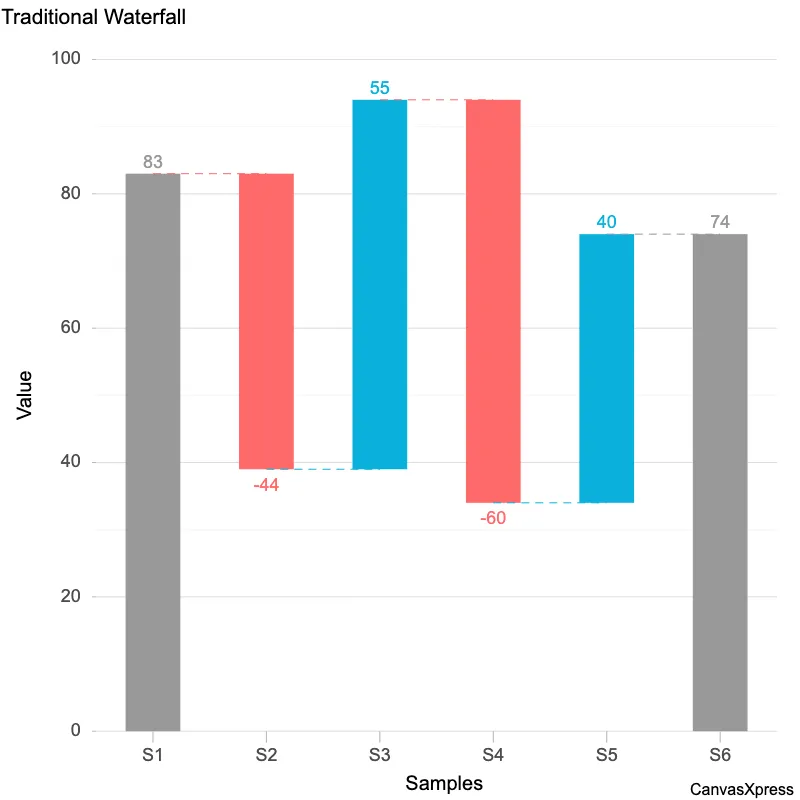
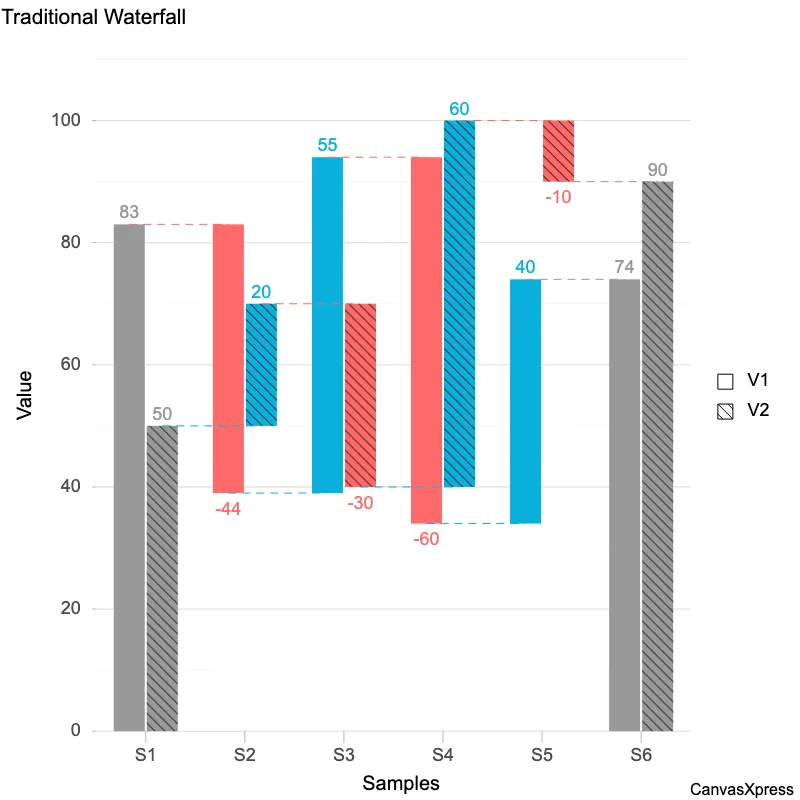
Waterfall: gains and losses between two levels
Waterfall graphs provide a clear, visual representation of data over time, making them ideal for tracking project progress or budget allocation. They are particularly useful for illustrating cumulative effects, showing how individual components contribute to a final total. Understanding waterfall charts enhances data interpretation, leading to better decision-making across various fields, from finance to software development. Their simplicity facilitates quick comprehension of complex datasets, enabling effective communication of key trends and insights.


<html>

  <head>
    <!-- Include the CanvasXpress library in your HTML file -->
    <link rel="stylesheet" href="https://www.canvasxpress.org/dist/canvasXpress.css" type="text/css"/>
    <script src="https://www.canvasxpress.org/dist/canvasXpress.min.js"></script>
  </head>

  <body>

    <!-- Create a canvas element for the chart with the desired dimensions -->
    <div>
      <canvas id="canvasId" width="600" height="600"></canvas>
    </div>


    <!-- Create a script to initialize the chart -->
    <script>

      // Use a data frame (2D-array) for the graph
      var data =

      // Create the configuration for the graph
      var config = {
         "graphType" : "Waterfall",
         "theme" : "stata",
         "xAxisGridMajorShow" : true,
         "xAxisGridMajorColor" : "rgb(200,212,214)",
         "waterfallNetColor" : "#777777",
         "waterfallIncreaseColor" : "#0072B2",
         "waterfallDecreaseColor" : "#E69F00",
         "graphOrientation" : "vertical",
         "xAxis" : [
            "Million cells"
         ],
         "xAxisTitle" : "Million cells",
         "setMinX" : 0,
         "setMaxX" : 320,
         "showLegend" : false,
         "smpTextRotate" : 0,
         "title" : "A cell culture gains far more than it loses",
         "subtitle" : "Cells at each step of one passage, in millions (synthetic)",
         "showDataValues" : true,
         "dataValuesPosition" : "outside"
      }

      // Event used to create graph (optional)
      var events = false

      // Call the CanvasXpress function to create the graph
      var cX = new CanvasXpress("canvasId", data, config, events);

    </script>

  </body>

</html>
<html>

  <head>
    <!-- Include the CanvasXpress library in your HTML file -->
    <link rel="stylesheet" href="https://www.canvasxpress.org/dist/canvasXpress.css" type="text/css"/>
    <script src="https://www.canvasxpress.org/dist/canvasXpress.min.js"></script>
  </head>

  <body>

    <!-- Create a canvas element for the chart with the desired dimensions -->
    <div>
      <canvas id="canvasId" width="600" height="600"></canvas>
    </div>


    <!-- Create a script to initialize the chart -->
    <script>

      // Create the data for the graph
      var data = {
         "y" : {
            "vars" : [
               "Million cells"
            ],
            "smps" : [
               "Seeded",
               "Division",
               "Growth after feed",
               "Second feed",
               "Attachment",
               "Apoptosis",
               "Contamination",
               "Passage loss",
               "Clumping",
               "Harvest"
            ],
            "data" : [
               [
                  120,
                  85,
                  40,
                  30,
                  15,
                  -45,
                  -10,
                  -30,
                  -12,
                  0
               ]
            ]
         }
      }

      // Create the configuration for the graph
      var config = {
         "graphType" : "Waterfall",
         "theme" : "stata",
         "xAxisGridMajorShow" : true,
         "xAxisGridMajorColor" : "rgb(200,212,214)",
         "waterfallNetColor" : "#777777",
         "waterfallIncreaseColor" : "#0072B2",
         "waterfallDecreaseColor" : "#E69F00",
         "graphOrientation" : "vertical",
         "xAxis" : [
            "Million cells"
         ],
         "xAxisTitle" : "Million cells",
         "setMinX" : 0,
         "setMaxX" : 320,
         "showLegend" : false,
         "smpTextRotate" : 0,
         "title" : "A cell culture gains far more than it loses",
         "subtitle" : "Cells at each step of one passage, in millions (synthetic)",
         "showDataValues" : true,
         "dataValuesPosition" : "outside"
      }

      // Event used to create graph (optional)
      var events = false

            // Call the CanvasXpress function to create the graph
      var cX = new CanvasXpress("canvasId", data, config, events);

    </script>

  </body>

</html>
library(canvasXpress)
y=read.table("https://www.canvasxpress.org/data/r/cX-waterfall7-dat.txt", header=TRUE, sep="\t", quote="", row.names=1, fill=TRUE, check.names=FALSE, stringsAsFactors=FALSE)
canvasXpress(
data=y,
dataValuesPosition="outside",
graphOrientation="vertical",
graphType="Waterfall",
setMaxX=320,
setMinX=0,
showDataValues=TRUE,
showLegend=FALSE,
smpTextRotate=0,
subtitle="Cells at each step of one passage, in millions (synthetic)",
theme="stata",
title="A cell culture gains far more than it loses",
waterfallDecreaseColor="#E69F00",
waterfallIncreaseColor="#0072B2",
waterfallNetColor="#777777",
xAxis=list("Million cells"),
xAxisGridMajorColor="rgb(200,212,214)",
xAxisGridMajorShow=TRUE,
xAxisTitle="Million cells"
)
from canvasxpress.canvas import CanvasXpress
from canvasxpress.plot import show_in_browser

if __name__ == "__main__":
  # Define the chart with its data and configuration
  chart: CanvasXpress = CanvasXpress(
    render_to = "waterfall7",
    data = {
      "y": {
        "vars": ["Million cells"],
        "smps": ["Seeded", "Division", "Growth after feed", "Second feed", "Attachment", "Apoptosis", "Contamination", "Passage loss", "Clumping", "Harvest"],
        "data": [
          [120, 85, 40, 30, 15, -45, -10, -30, -12, 0]
        ]
      }
    },
    config = {
      "graphType": "Waterfall",
      "theme": "stata",
      "xAxisGridMajorShow": True,
      "xAxisGridMajorColor": "rgb(200,212,214)",
      "waterfallNetColor": "#777777",
      "waterfallIncreaseColor": "#0072B2",
      "waterfallDecreaseColor": "#E69F00",
      "graphOrientation": "vertical",
      "xAxis": ["Million cells"],
      "xAxisTitle": "Million cells",
      "setMinX": 0,
      "setMaxX": 320,
      "showLegend": False,
      "smpTextRotate": 0,
      "title": "A cell culture gains far more than it loses",
      "subtitle": "Cells at each step of one passage, in millions (synthetic)",
      "showDataValues": True,
      "dataValuesPosition": "outside"
    },
    width = 760,
    height = 540
  )

  # Display the chart in its own Web page
  show_in_browser(chart)
Run this notebook:

from canvasxpress.canvas import CanvasXpress
from canvasxpress.plot import graph

graph(
  CanvasXpress(
    render_to = "waterfall7",
    data = {
      "y": {
        "vars": ["Million cells"],
        "smps": ["Seeded", "Division", "Growth after feed", "Second feed", "Attachment", "Apoptosis", "Contamination", "Passage loss", "Clumping", "Harvest"],
        "data": [
          [120, 85, 40, 30, 15, -45, -10, -30, -12, 0]
        ]
      }
    },
    config = {
      "graphType": "Waterfall",
      "theme": "stata",
      "xAxisGridMajorShow": True,
      "xAxisGridMajorColor": "rgb(200,212,214)",
      "waterfallNetColor": "#777777",
      "waterfallIncreaseColor": "#0072B2",
      "waterfallDecreaseColor": "#E69F00",
      "graphOrientation": "vertical",
      "xAxis": ["Million cells"],
      "xAxisTitle": "Million cells",
      "setMinX": 0,
      "setMaxX": 320,
      "showLegend": False,
      "smpTextRotate": 0,
      "title": "A cell culture gains far more than it loses",
      "subtitle": "Cells at each step of one passage, in millions (synthetic)",
      "showDataValues": True,
      "dataValuesPosition": "outside"
    },
    width = 760,
    height = 540
  )
)
using CanvasXpress

canvasxpress(Dict(
  "y" => Dict(
    "vars" => ["Million cells"],
    "smps" => ["Seeded", "Division", "Growth after feed", "Second feed", "Attachment", "Apoptosis", "Contamination", "Passage loss", "Clumping", "Harvest"],
    "data" => [
      [120, 85, 40, 30, 15, -45, -10, -30, -12, 0]
    ]
  )
);
  graphType = "Waterfall",
  theme = "stata",
  xAxisGridMajorShow = true,
  xAxisGridMajorColor = "rgb(200,212,214)",
  waterfallNetColor = "#777777",
  waterfallIncreaseColor = "#0072B2",
  waterfallDecreaseColor = "#E69F00",
  graphOrientation = "vertical",
  xAxis = ["Million cells"],
  xAxisTitle = "Million cells",
  setMinX = 0,
  setMaxX = 320,
  showLegend = false,
  smpTextRotate = 0,
  title = "A cell culture gains far more than it loses",
  subtitle = "Cells at each step of one passage, in millions (synthetic)",
  showDataValues = true,
  dataValuesPosition = "outside"
)