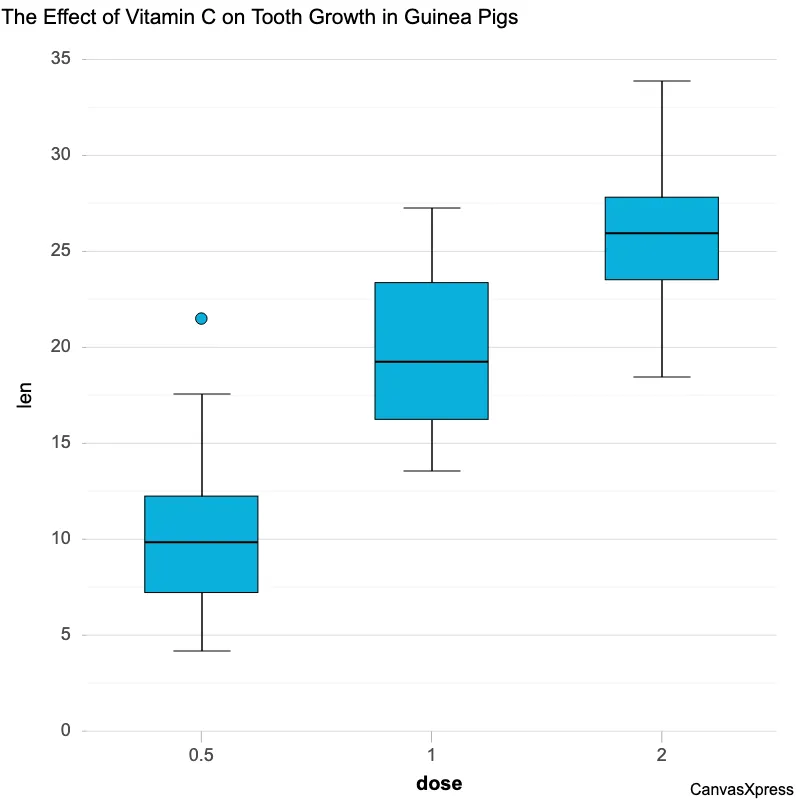
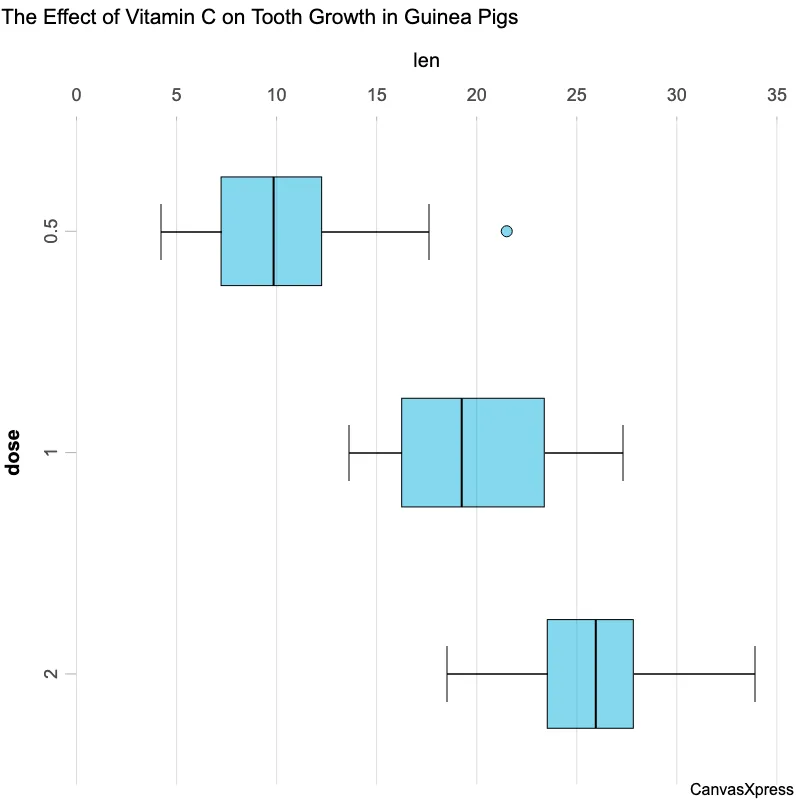
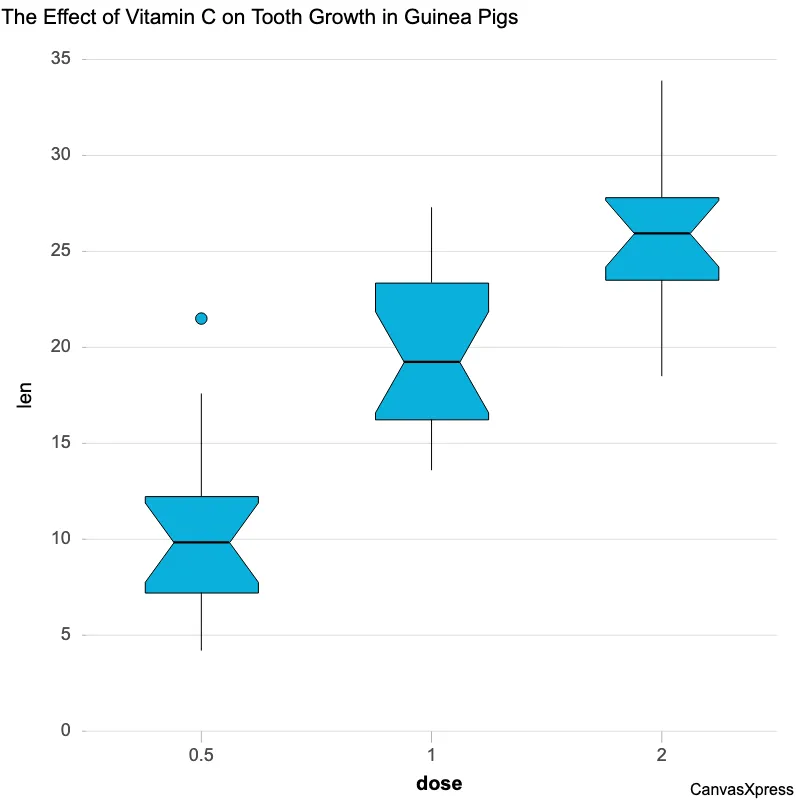
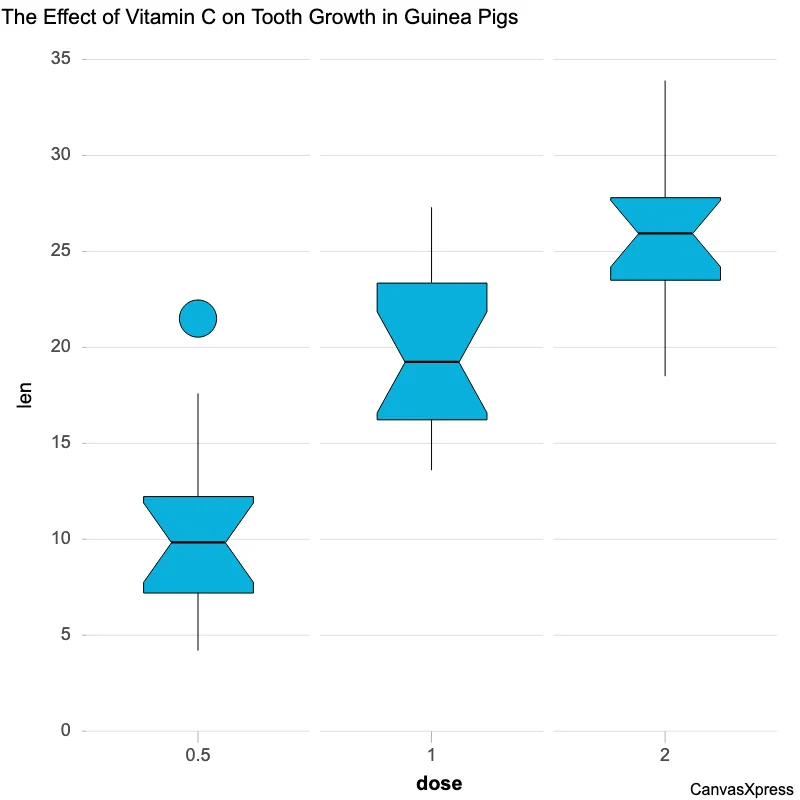
Comparing Data Distributions with Box Plots
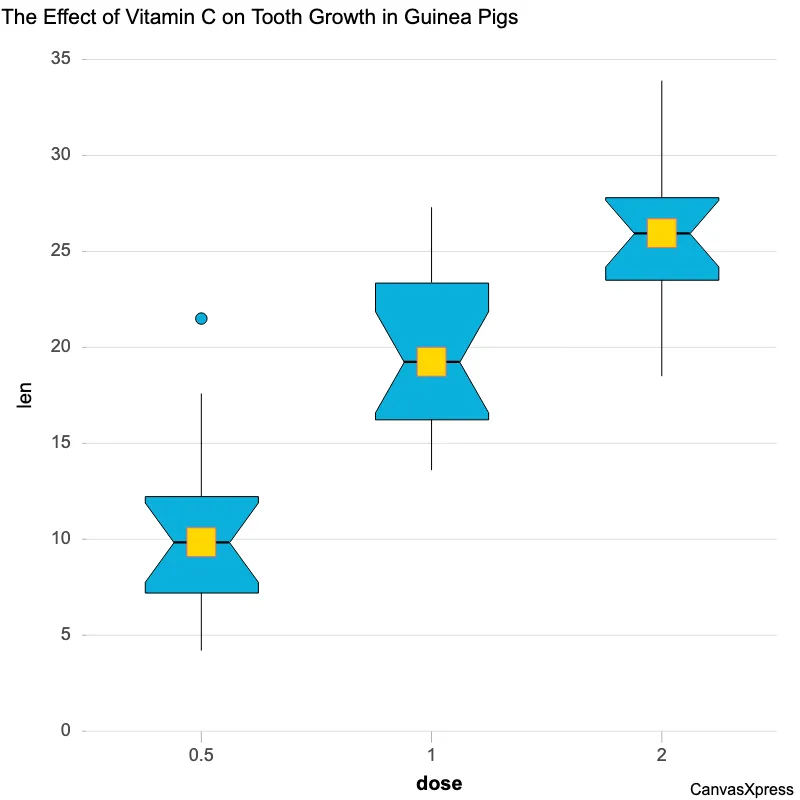
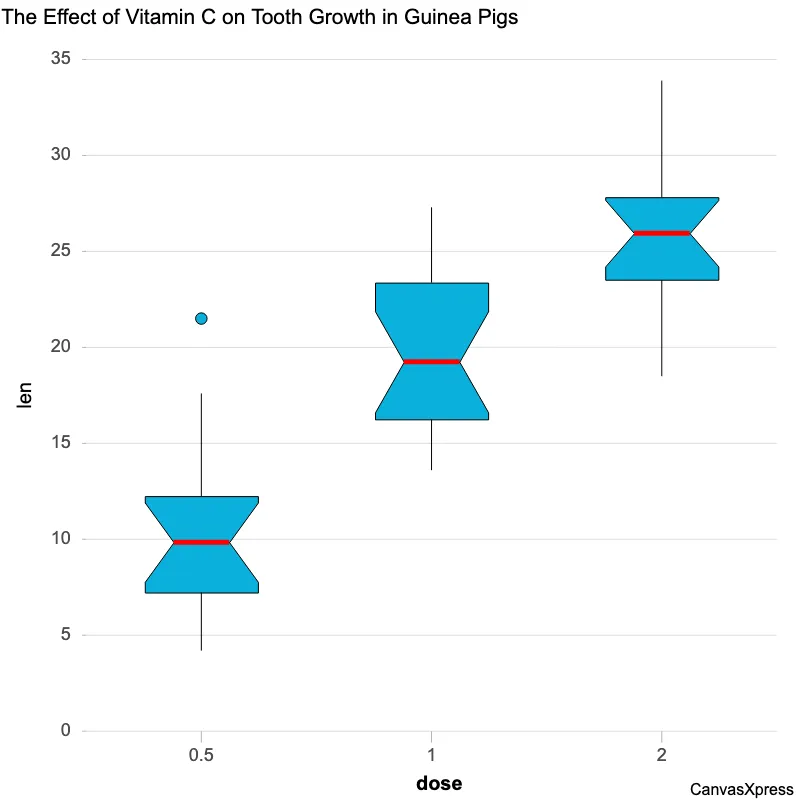
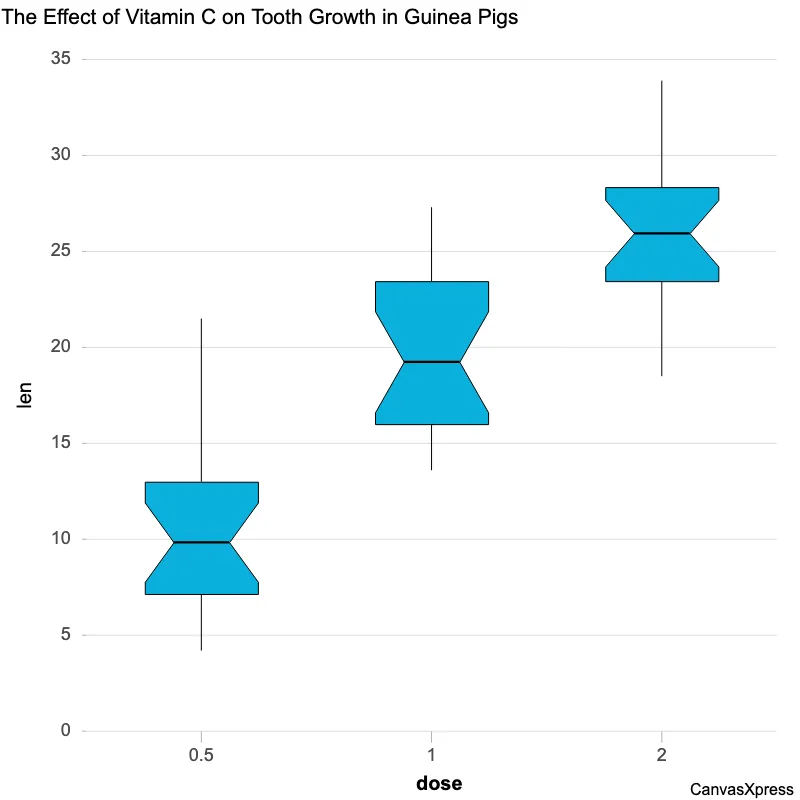
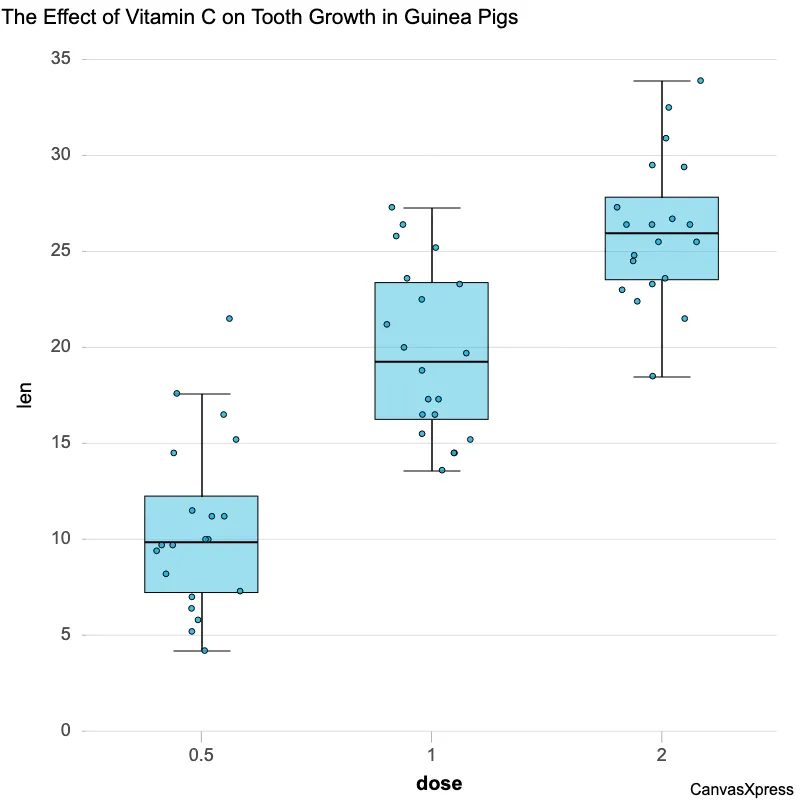
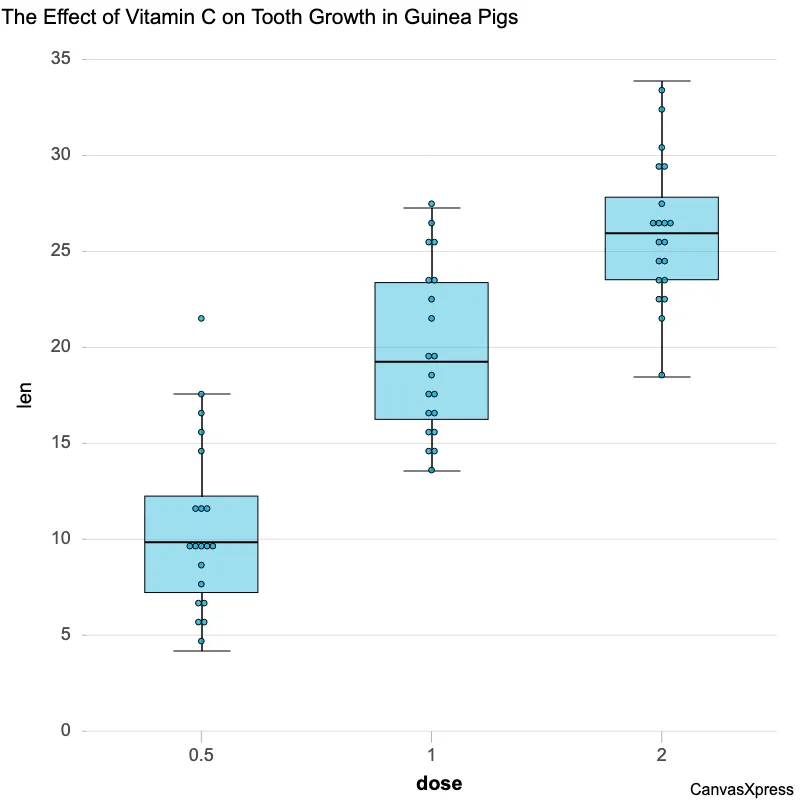
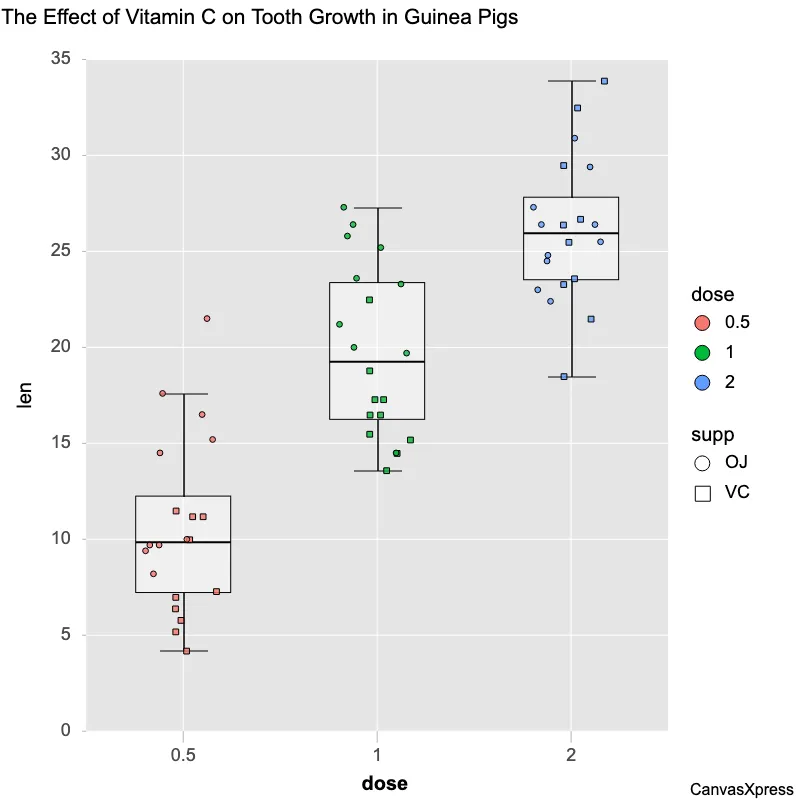
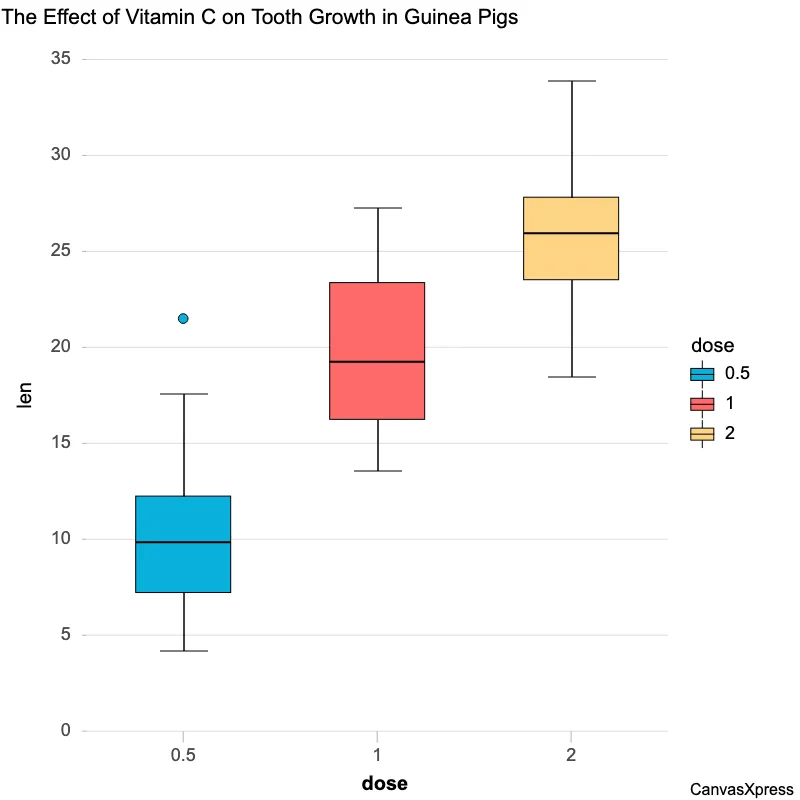
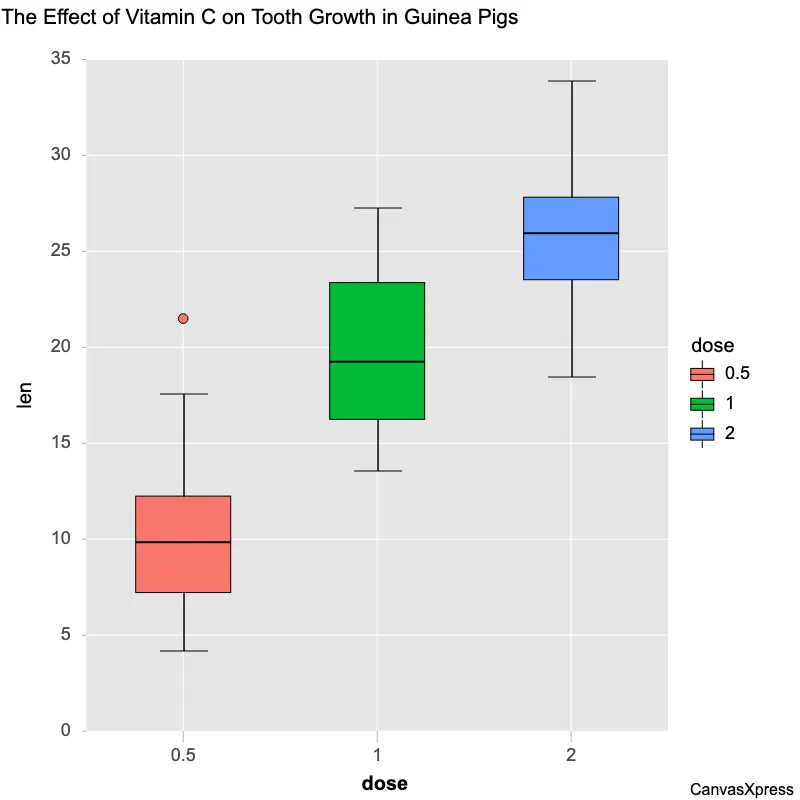
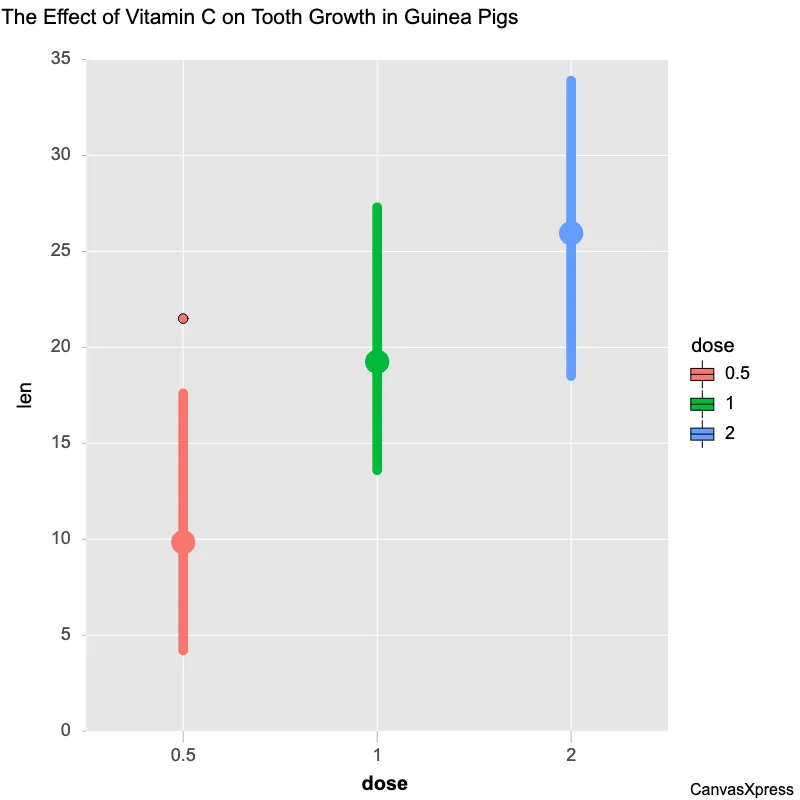
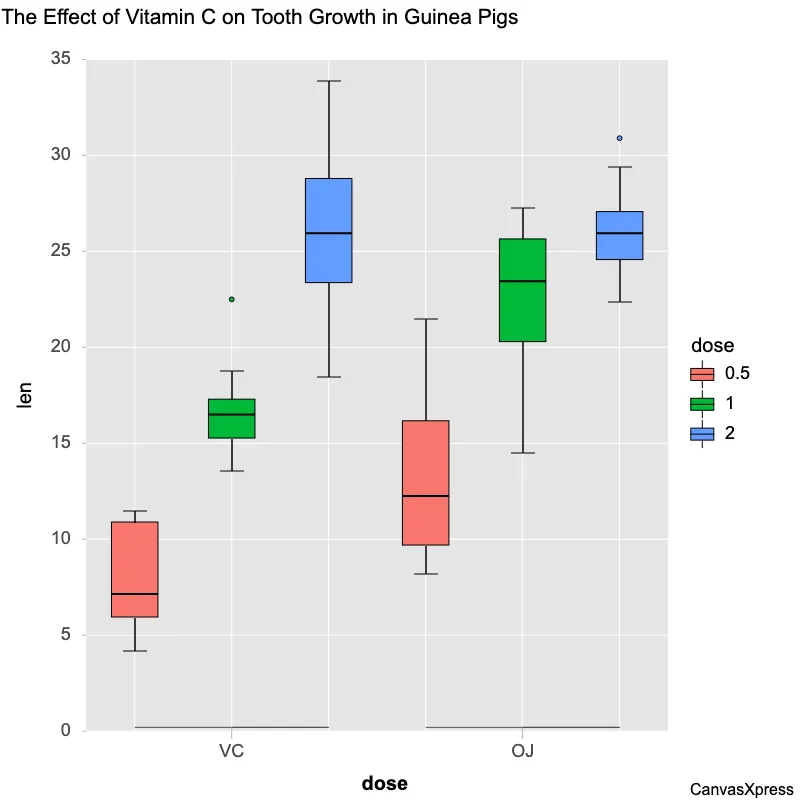
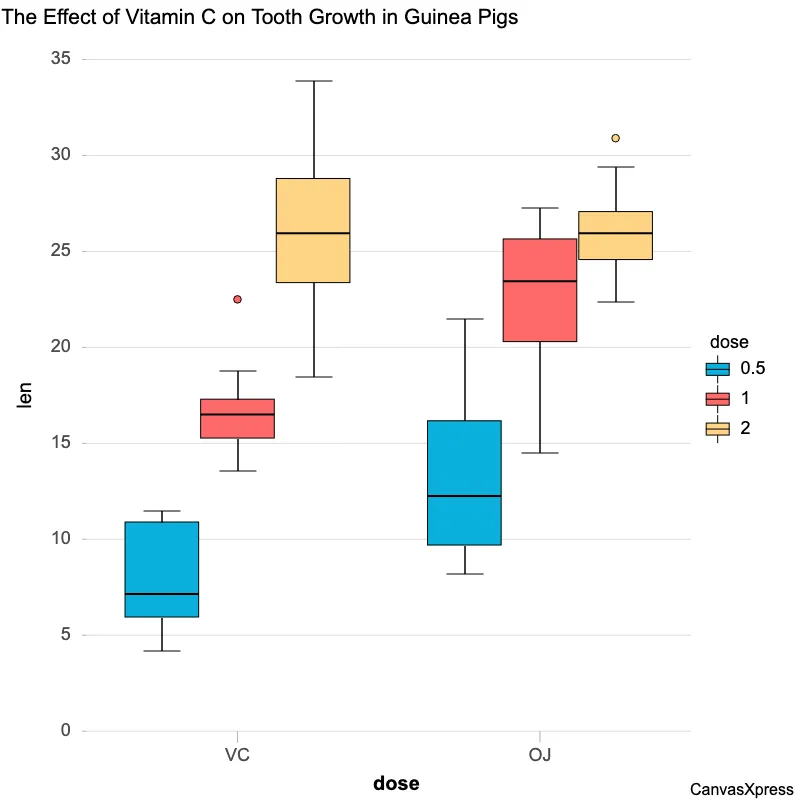
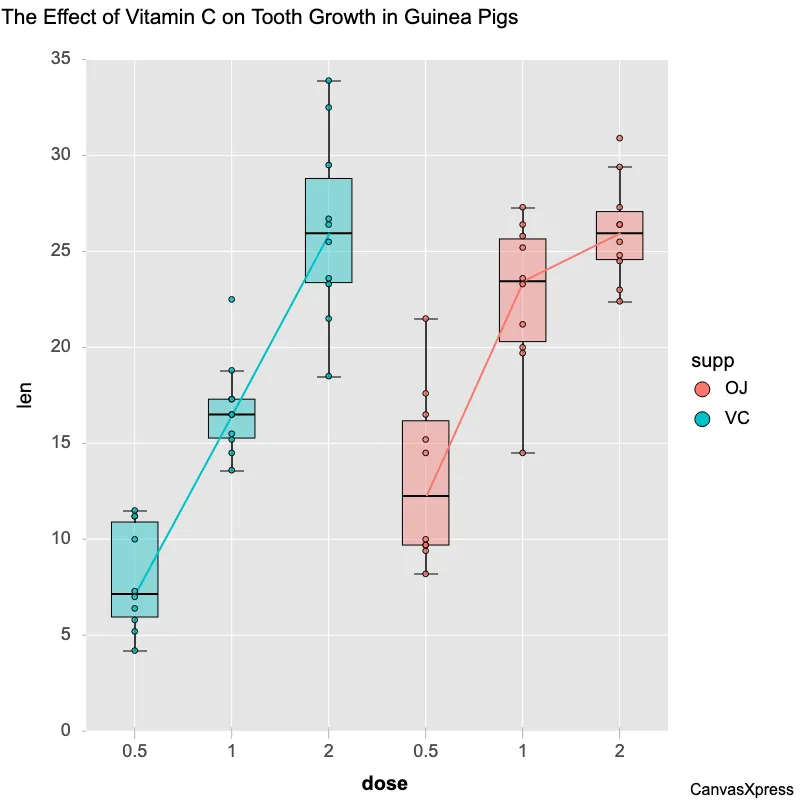
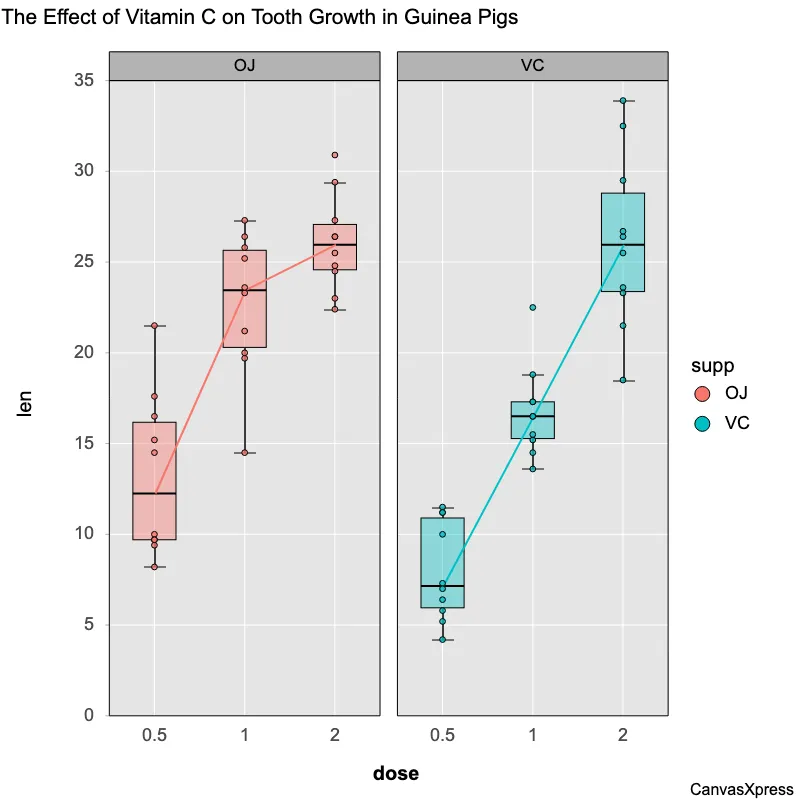
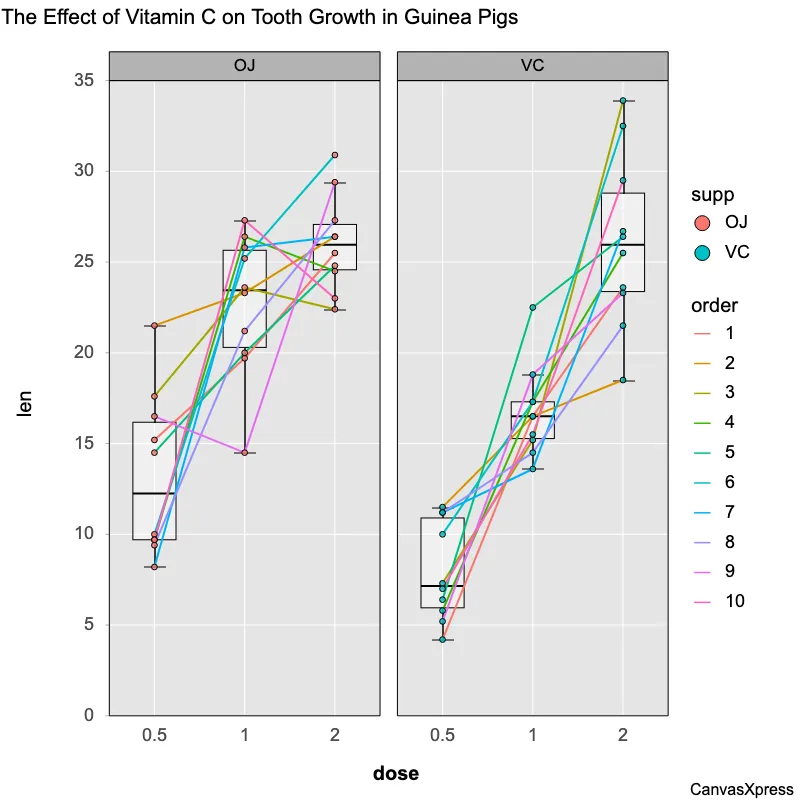
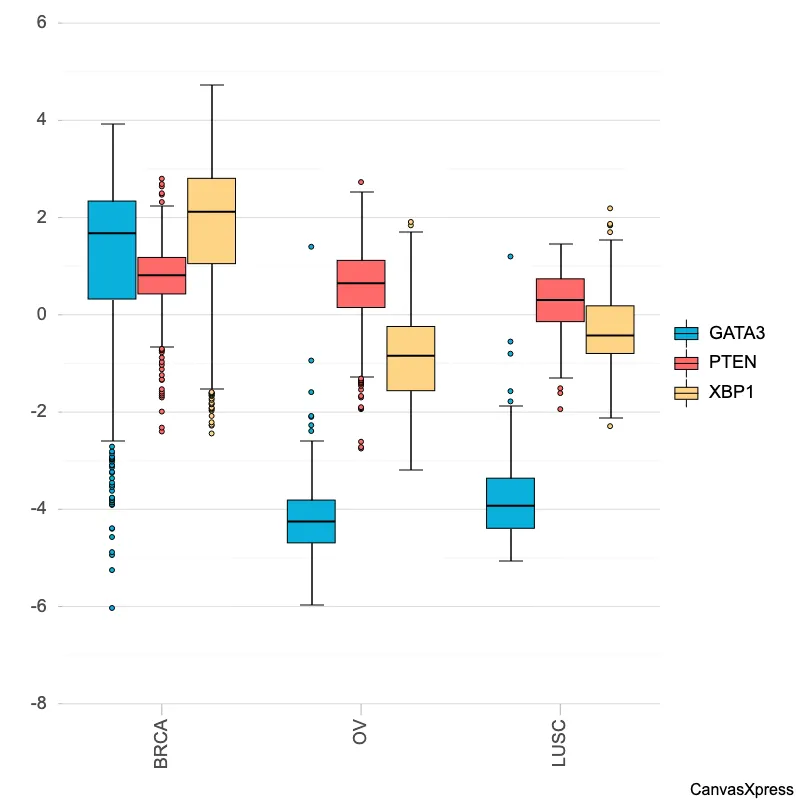
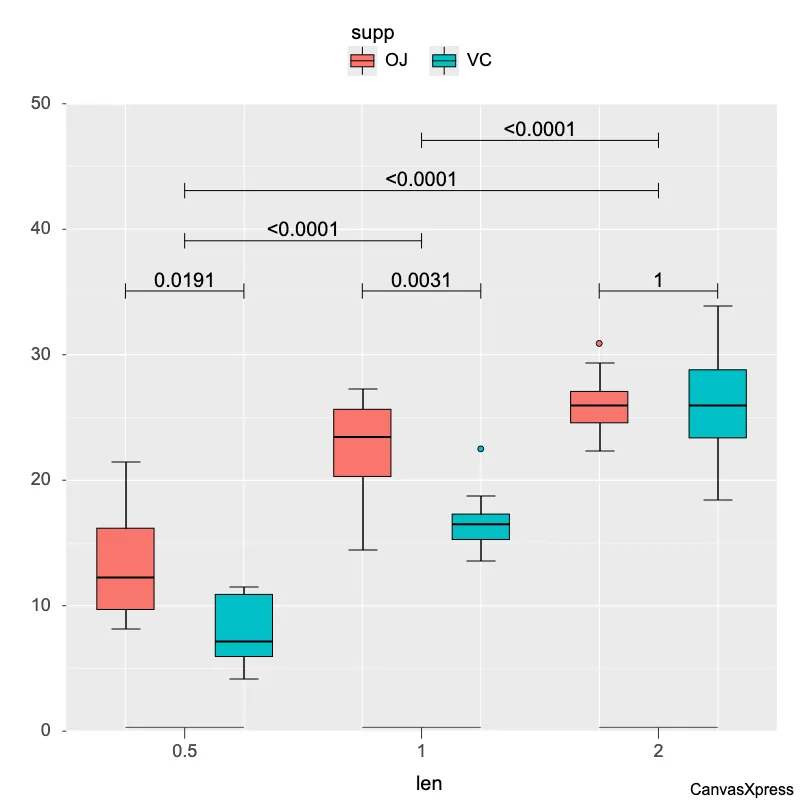
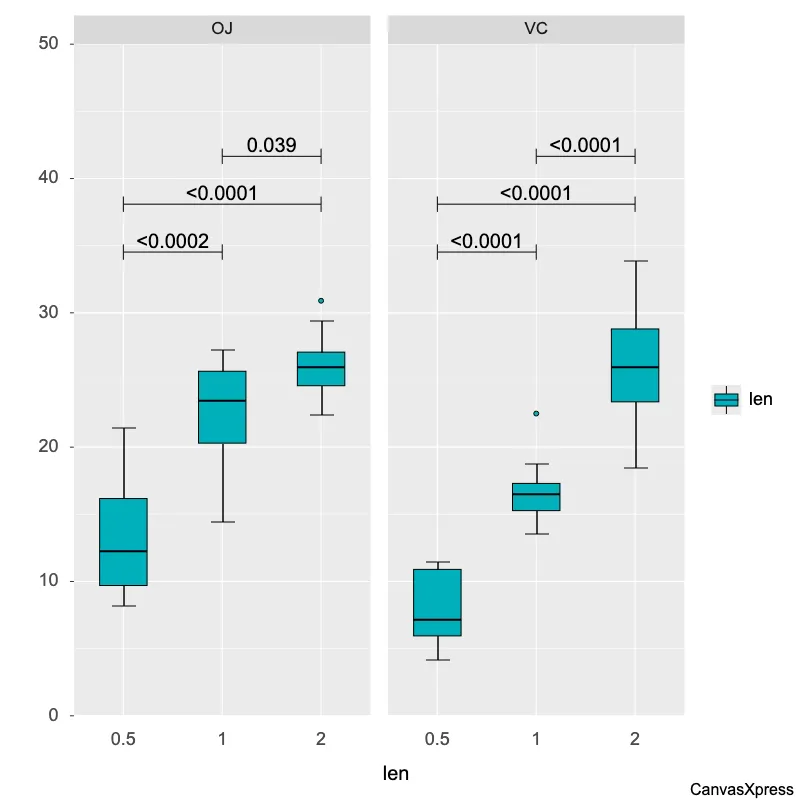
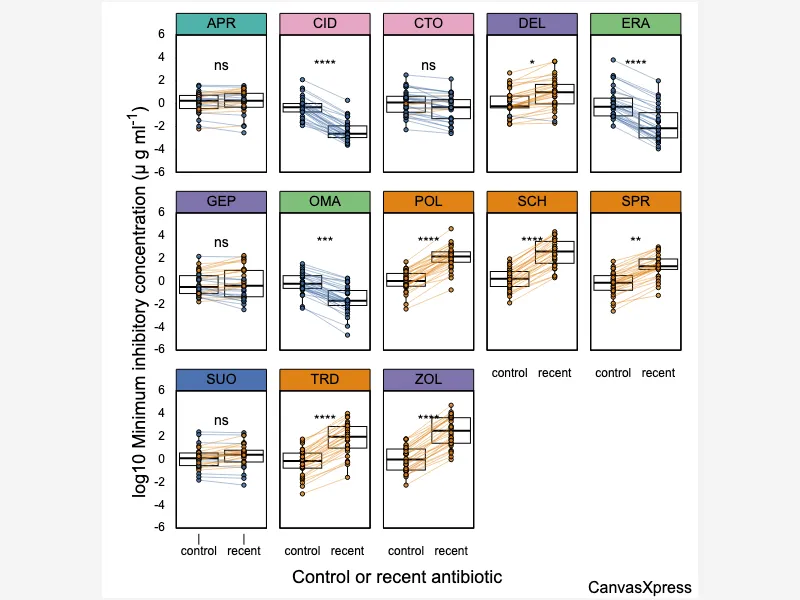
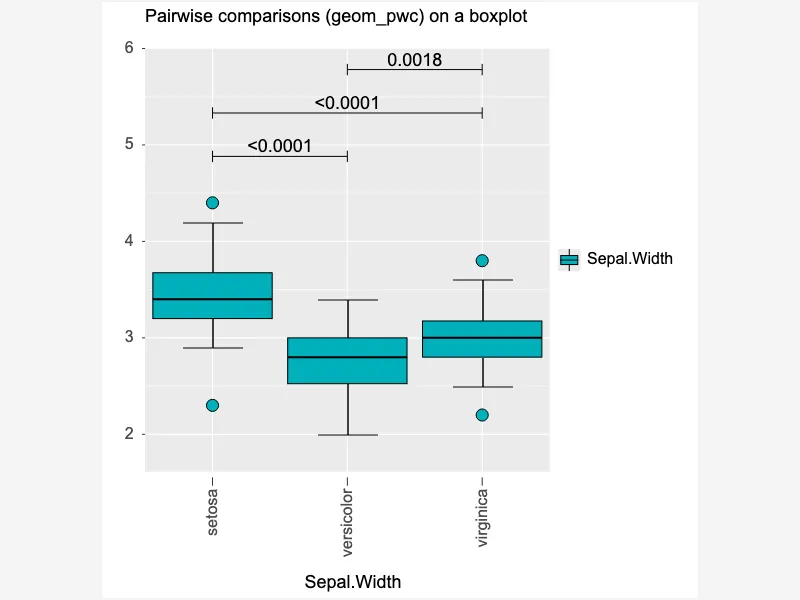
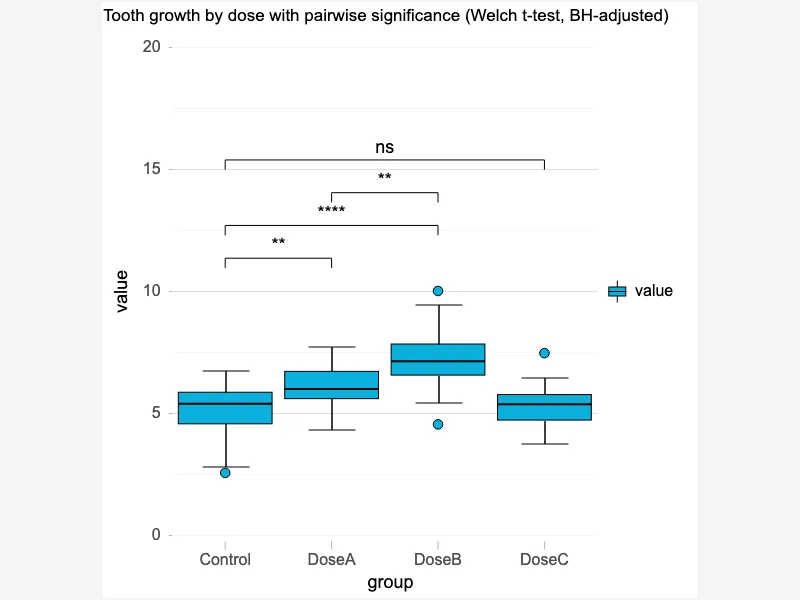
Boxplot graphs, also known as box and whisker plots, offer a compelling way to visually display the distribution and summary statistics of a dataset. They present key descriptive statistics such as median, quartiles, and potential outliers, making them ideal for comparing data across different groups or identifying unusual data points. Understanding boxplot graphs is essential for data analysis. These graphs quickly reveal central tendency, spread, and skewness, providing valuable insights for decision-making. Their effectiveness in visualizing data makes them a staple in various fields, from finance and healthcare to engineering and social sciences.


<html>

  <head>
    <!-- Include the CanvasXpress library in your HTML file -->
    <link rel="stylesheet" href="https://www.canvasxpress.org/dist/canvasXpress.css" type="text/css"/>
    <script src="https://www.canvasxpress.org/dist/canvasXpress.min.js"></script>
  </head>

  <body>

    <!-- Create a canvas element for the chart with the desired dimensions -->
    <div>
      <canvas id="canvasId" width="600" height="600"></canvas>
    </div>


    <!-- Create a script to initialize the chart -->
    <script>

      // Use a data frame (2D-array) for the graph
      var data = [
        [ "Id", "len", "order", "dose", "supp"],
        [ "Var1", 4.2, 1, "0.5", "VC"],
        [ "Var2", 11.5, 2, "0.5", "VC"],
        [ "Var3", 7.3, 3, "0.5", "VC"],
        [ "Var4", 5.8, 4, "0.5", "VC"],
        [ "Var5", 6.4, 5, "0.5", "VC"],
        [ "Var6", 10, 6, "0.5", "VC"],
        [ "Var7", 11.2, 7, "0.5", "VC"],
        [ "Var8", 11.2, 8, "0.5", "VC"],
        [ "Var9", 5.2, 9, "0.5", "VC"],
        [ "Var10", 7, 10, "0.5", "VC"],
        [ "Var11", 16.5, 1, "1", "VC"],
        [ "Var12", 16.5, 2, "1", "VC"],
        [ "Var13", 15.2, 3, "1", "VC"],
        [ "Var14", 17.3, 4, "1", "VC"],
        [ "Var15", 22.5, 5, "1", "VC"],
        [ "Var16", 17.3, 6, "1", "VC"],
        [ "Var17", 13.6, 7, "1", "VC"],
        [ "Var18", 14.5, 8, "1", "VC"],
        [ "Var19", 18.8, 9, "1", "VC"],
        [ "Var20", 15.5, 10, "1", "VC"],
        [ "Var21", 23.6, 1, "2", "VC"],
        [ "Var22", 18.5, 2, "2", "VC"],
        [ "Var23", 33.9, 3, "2", "VC"],
        [ "Var24", 25.5, 4, "2", "VC"],
        [ "Var25", 26.4, 5, "2", "VC"],
        [ "Var26", 32.5, 6, "2", "VC"],
        [ "Var27", 26.7, 7, "2", "VC"],
        [ "Var28", 21.5, 8, "2", "VC"],
        // ... (data truncated after 29 records for clarity)
      ]

      // Create the configuration for the graph
      var config = {
         "boxplotColor" : "#00AFBB",
         "decorations" : {
            "marker" : [{"color" : "black","group" : 0,"group2" : 1,"scope" : ["OJ"],
                  "text" : "<0.0002",
                  "type" : "pwc",
                  "variable" : "len",
                  "ymax" : 35.385,
                  "ymin" : 34.494
               },
               {
                  "color" : "black",
                  "group" : 0,
                  "group2" : 2,
                  "scope" : ["OJ"],
                  "text" : "<0.0001",
                  "type" : "pwc",
                  "variable" : "len",
                  "ymax" : 38.949,
                  "ymin" : 38.058
               },
               {
                  "color" : "black",
                  "group" : 1,
                  "group2" : 2,
                  "scope" : ["OJ"],
                  "text" : "0.039",
                  "type" : "pwc",
                  "variable" : "len",
                  "ymax" : 42.513,
                  "ymin" : 41.622
               },
               {
                  "color" : "black",
                  "group" : 0,
                  "group2" : 1,
                  "scope" : ["VC"],
                  "text" : "<0.0001",
                  "type" : "pwc",
                  "variable" : "len",
                  "ymax" : 35.385,
                  "ymin" : 34.494
               },
               {
                  "color" : "black",
                  "group" : 0,
                  "group2" : 2,
                  "scope" : ["VC"],
                  "text" : "<0.0001",
                  "type" : "pwc",
                  "variable" : "len",
                  "ymax" : 38.949,
                  "ymin" : 38.058
               },
               {
                  "color" : "black",
                  "group" : 1,
                  "group2" : 2,
                  "scope" : ["VC"],
                  "text" : "<0.0001",
                  "type" : "pwc",
                  "variable" : "len",
                  "ymax" : 42.513,
                  "ymin" : 41.622
               }
            ]
         },
         "graphOrientation" : "vertical",
         "graphType" : "Boxplot",
         "groupingFactors" : ["dose"],
         "layoutTopology" : "1X2",
         "segregateSamplesBy" : ["supp"],
         "smpTextRotate" : 90,
         "smpTitle" : "len",
         "sortOnGrouping" : "ascending",
         "theme" : "GGPlot",
         "xAxis" : ["len"]
      }

      // Event used to create graph (optional)
      var events = false

      // Call the CanvasXpress function to create the graph
      var cX = new CanvasXpress("canvasId", data, config, events);

    </script>

  </body>

</html>
<html>

  <head>
    <!-- Include the CanvasXpress library in your HTML file -->
    <link rel="stylesheet" href="https://www.canvasxpress.org/dist/canvasXpress.css" type="text/css"/>
    <script src="https://www.canvasxpress.org/dist/canvasXpress.min.js"></script>
  </head>

  <body>

    <!-- Create a canvas element for the chart with the desired dimensions -->
    <div>
      <canvas id="canvasId" width="600" height="600"></canvas>
    </div>


    <!-- Create a script to initialize the chart -->
    <script>

      // Create the data for the graph
      var data = {
         "x" : {
            "dose" : ["0.5","0.5","0.5","0.5","0.5","0.5","0.5","0.5","0.5","0.5","1","1","1","1","1","1","1","1","1","1","2","2","2","2","2","2","2","2","2","2","0.5","0.5","0.5","0.5","0.5","0.5","0.5","0.5","0.5","0.5","1","1","1","1","1","1","1","1","1","1","2","2","2","2","2","2","2","2","2","2"],
            "order" : [1,2,3,4,5,6,7,8,9,10,1,2,3,4,5,6,7,8,9,10,1,2,3,4,5,6,7,8,9,10,1,2,3,4,5,6,7,8,9,10,1,2,3,4,5,6,7,8,9,10,1,2,3,4,5,6,7,8,9,10],
            "supp" : ["VC","VC","VC","VC","VC","VC","VC","VC","VC","VC","VC","VC","VC","VC","VC","VC","VC","VC","VC","VC","VC","VC","VC","VC","VC","VC","VC","VC","VC","VC","OJ","OJ","OJ","OJ","OJ","OJ","OJ","OJ","OJ","OJ","OJ","OJ","OJ","OJ","OJ","OJ","OJ","OJ","OJ","OJ","OJ","OJ","OJ","OJ","OJ","OJ","OJ","OJ","OJ","OJ"]
         },
         "y" : {
            "data" : [
              [4.2,11.5,7.3,5.8,6.4,10,11.2,11.2,5.2,7,16.5,16.5,15.2,17.3,22.5,17.3,13.6,14.5,18.8,15.5,23.6,18.5,33.9,25.5,26.4,32.5,26.7,21.5,23.3,29.5,15.2,21.5,17.6,9.7,14.5,10,8.2,9.4,16.5,9.7,19.7,23.3,23.6,26.4,20,25.2,25.8,21.2,14.5,27.3,25.5,26.4,22.4,24.5,24.8,30.9,26.4,27.3,29.4,23]
            ],
            "smps" : ["Var1","Var2","Var3","Var4","Var5","Var6","Var7","Var8","Var9","Var10","Var11","Var12","Var13","Var14","Var15","Var16","Var17","Var18","Var19","Var20","Var21","Var22","Var23","Var24","Var25","Var26","Var27","Var28","Var29","Var30","Var31","Var32","Var33","Var34","Var35","Var36","Var37","Var38","Var39","Var40","Var41","Var42","Var43","Var44","Var45","Var46","Var47","Var48","Var49","Var50","Var51","Var52","Var53","Var54","Var55","Var56","Var57","Var58","Var59","Var60"],
            "vars" : ["len"]
         }
      }

      // Create the configuration for the graph
      var config = {
         "boxplotColor" : "#00AFBB",
         "decorations" : {
            "marker" : [{"color" : "black","group" : 0,"group2" : 1,"scope" : ["OJ"],
                  "text" : "<0.0002",
                  "type" : "pwc",
                  "variable" : "len",
                  "ymax" : 35.385,
                  "ymin" : 34.494
               },
               {
                  "color" : "black",
                  "group" : 0,
                  "group2" : 2,
                  "scope" : ["OJ"],
                  "text" : "<0.0001",
                  "type" : "pwc",
                  "variable" : "len",
                  "ymax" : 38.949,
                  "ymin" : 38.058
               },
               {
                  "color" : "black",
                  "group" : 1,
                  "group2" : 2,
                  "scope" : ["OJ"],
                  "text" : "0.039",
                  "type" : "pwc",
                  "variable" : "len",
                  "ymax" : 42.513,
                  "ymin" : 41.622
               },
               {
                  "color" : "black",
                  "group" : 0,
                  "group2" : 1,
                  "scope" : ["VC"],
                  "text" : "<0.0001",
                  "type" : "pwc",
                  "variable" : "len",
                  "ymax" : 35.385,
                  "ymin" : 34.494
               },
               {
                  "color" : "black",
                  "group" : 0,
                  "group2" : 2,
                  "scope" : ["VC"],
                  "text" : "<0.0001",
                  "type" : "pwc",
                  "variable" : "len",
                  "ymax" : 38.949,
                  "ymin" : 38.058
               },
               {
                  "color" : "black",
                  "group" : 1,
                  "group2" : 2,
                  "scope" : ["VC"],
                  "text" : "<0.0001",
                  "type" : "pwc",
                  "variable" : "len",
                  "ymax" : 42.513,
                  "ymin" : 41.622
               }
            ]
         },
         "graphOrientation" : "vertical",
         "graphType" : "Boxplot",
         "groupingFactors" : ["dose"],
         "layoutTopology" : "1X2",
         "segregateSamplesBy" : ["supp"],
         "smpTextRotate" : 90,
         "smpTitle" : "len",
         "sortOnGrouping" : "ascending",
         "theme" : "GGPlot",
         "xAxis" : ["len"]
      }

      // Event used to create graph (optional)
      var events = false

            // Call the CanvasXpress function to create the graph
      var cX = new CanvasXpress("canvasId", data, config, events);

    </script>

  </body>

</html>
library(canvasXpress)
y=read.table("https://www.canvasxpress.org/data/r/cX-toothgrowth-dat.txt", header=TRUE, sep="\t", quote="", row.names=1, fill=TRUE, check.names=FALSE, stringsAsFactors=FALSE)
x=read.table("https://www.canvasxpress.org/data/r/cX-toothgrowth-smp.txt", header=TRUE, sep="\t", quote="", row.names=1, fill=TRUE, check.names=FALSE, stringsAsFactors=FALSE)
canvasXpress(
data=y,
smpAnnot=x,
boxplotColor="#00AFBB",
decorations=list(marker=list(list(color="black", group=0, group2=1, scope=list("OJ"), text="<0.0002", type="pwc", variable="len", ymax=35.385, ymin=34.494), list(color="black", group=0, group2=2, scope=list("OJ"), text="<0.0001", type="pwc", variable="len", ymax=38.949, ymin=38.058), list(color="black", group=1, group2=2, scope=list("OJ"), text=0.039, type="pwc", variable="len", ymax=42.513, ymin=41.622), list(color="black", group=0, group2=1, scope=list("VC"), text="<0.0001", type="pwc", variable="len", ymax=35.385, ymin=34.494), list(color="black", group=0, group2=2, scope=list("VC"), text="<0.0001", type="pwc", variable="len", ymax=38.949, ymin=38.058), list(color="black", group=1, group2=2, scope=list("VC"), text="<0.0001", type="pwc", variable="len", ymax=42.513, ymin=41.622))),
graphOrientation="vertical",
graphType="Boxplot",
groupingFactors=list("dose"),
layoutTopology="1X2",
segregateSamplesBy=list("supp"),
smpTextRotate=90,
smpTitle="len",
sortOnGrouping="ascending",
theme="GGPlot",
xAxis=list("len")
)
from canvasxpress.canvas import CanvasXpress
from canvasxpress.plot import show_in_browser

if __name__ == "__main__":
  # Define the chart with its data and configuration
  chart: CanvasXpress = CanvasXpress(
    render_to = "boxplot21",
    data = {
      "x": {
        "dose": ["0.5", "0.5", "0.5", "0.5", "0.5", "0.5", "0.5", "0.5", "0.5", "0.5", "1", "1", "1", "1", "1", "1", "1", "1", "1", "1", "2", "2", "2", "2", "2", "2", "2", "2", "2", "2", "0.5", "0.5", "0.5", "0.5", "0.5", "0.5", "0.5", "0.5", "0.5", "0.5", "1", "1", "1", "1", "1", "1", "1", "1", "1", "1", "2", "2", "2", "2", "2", "2", "2", "2", "2", "2"],
        "order": [1, 2, 3, 4, 5, 6, 7, 8, 9, 10, 1, 2, 3, 4, 5, 6, 7, 8, 9, 10, 1, 2, 3, 4, 5, 6, 7, 8, 9, 10, 1, 2, 3, 4, 5, 6, 7, 8, 9, 10, 1, 2, 3, 4, 5, 6, 7, 8, 9, 10, 1, 2, 3, 4, 5, 6, 7, 8, 9, 10],
        "supp": ["VC", "VC", "VC", "VC", "VC", "VC", "VC", "VC", "VC", "VC", "VC", "VC", "VC", "VC", "VC", "VC", "VC", "VC", "VC", "VC", "VC", "VC", "VC", "VC", "VC", "VC", "VC", "VC", "VC", "VC", "OJ", "OJ", "OJ", "OJ", "OJ", "OJ", "OJ", "OJ", "OJ", "OJ", "OJ", "OJ", "OJ", "OJ", "OJ", "OJ", "OJ", "OJ", "OJ", "OJ", "OJ", "OJ", "OJ", "OJ", "OJ", "OJ", "OJ", "OJ", "OJ", "OJ"]
      },
      "y": {
        "data": [
          [4.2, 11.5, 7.3, 5.8, 6.4, 10, 11.2, 11.2, 5.2, 7, 16.5, 16.5, 15.2, 17.3, 22.5, 17.3, 13.6, 14.5, 18.8, 15.5, 23.6, 18.5, 33.9, 25.5, 26.4, 32.5, 26.7, 21.5, 23.3, 29.5, 15.2, 21.5, 17.6, 9.7, 14.5, 10, 8.2, 9.4, 16.5, 9.7, 19.7, 23.3, 23.6, 26.4, 20, 25.2, 25.8, 21.2, 14.5, 27.3, 25.5, 26.4, 22.4, 24.5, 24.8, 30.9, 26.4, 27.3, 29.4, 23]
        ],
        "smps": ["Var1", "Var2", "Var3", "Var4", "Var5", "Var6", "Var7", "Var8", "Var9", "Var10", "Var11", "Var12", "Var13", "Var14", "Var15", "Var16", "Var17", "Var18", "Var19", "Var20", "Var21", "Var22", "Var23", "Var24", "Var25", "Var26", "Var27", "Var28", "Var29", "Var30", "Var31", "Var32", "Var33", "Var34", "Var35", "Var36", "Var37", "Var38", "Var39", "Var40", "Var41", "Var42", "Var43", "Var44", "Var45", "Var46", "Var47", "Var48", "Var49", "Var50", "Var51", "Var52", "Var53", "Var54", "Var55", "Var56", "Var57", "Var58", "Var59", "Var60"],
        "vars": ["len"]
      }
    },
    config = {
      "boxplotColor": "#00AFBB",
      "decorations": {
        "marker": [
          {
            "color": "black",
            "group": 0,
            "group2": 1,
            "scope": ["OJ"],
            "text": "<0.0002",
            "type": "pwc",
            "variable": "len",
            "ymax": 35.385,
            "ymin": 34.494
          },
          {
            "color": "black",
            "group": 0,
            "group2": 2,
            "scope": ["OJ"],
            "text": "<0.0001",
            "type": "pwc",
            "variable": "len",
            "ymax": 38.949,
            "ymin": 38.058
          },
          {
            "color": "black",
            "group": 1,
            "group2": 2,
            "scope": ["OJ"],
            "text": "0.039",
            "type": "pwc",
            "variable": "len",
            "ymax": 42.513,
            "ymin": 41.622
          },
          {
            "color": "black",
            "group": 0,
            "group2": 1,
            "scope": ["VC"],
            "text": "<0.0001",
            "type": "pwc",
            "variable": "len",
            "ymax": 35.385,
            "ymin": 34.494
          },
          {
            "color": "black",
            "group": 0,
            "group2": 2,
            "scope": ["VC"],
            "text": "<0.0001",
            "type": "pwc",
            "variable": "len",
            "ymax": 38.949,
            "ymin": 38.058
          },
          {
            "color": "black",
            "group": 1,
            "group2": 2,
            "scope": ["VC"],
            "text": "<0.0001",
            "type": "pwc",
            "variable": "len",
            "ymax": 42.513,
            "ymin": 41.622
          }
        ]
      },
      "graphOrientation": "vertical",
      "graphType": "Boxplot",
      "groupingFactors": ["dose"],
      "layoutTopology": "1X2",
      "segregateSamplesBy": ["supp"],
      "smpTextRotate": 90,
      "smpTitle": "len",
      "sortOnGrouping": "ascending",
      "theme": "GGPlot",
      "xAxis": ["len"]
    },
    width = 600,
    height = 600
  )

  # Display the chart in its own Web page
  show_in_browser(chart)
Run this notebook:

from canvasxpress.canvas import CanvasXpress
from canvasxpress.plot import graph

graph(
  CanvasXpress(
    render_to = "boxplot21",
    data = {
      "x": {
        "dose": ["0.5", "0.5", "0.5", "0.5", "0.5", "0.5", "0.5", "0.5", "0.5", "0.5", "1", "1", "1", "1", "1", "1", "1", "1", "1", "1", "2", "2", "2", "2", "2", "2", "2", "2", "2", "2", "0.5", "0.5", "0.5", "0.5", "0.5", "0.5", "0.5", "0.5", "0.5", "0.5", "1", "1", "1", "1", "1", "1", "1", "1", "1", "1", "2", "2", "2", "2", "2", "2", "2", "2", "2", "2"],
        "order": [1, 2, 3, 4, 5, 6, 7, 8, 9, 10, 1, 2, 3, 4, 5, 6, 7, 8, 9, 10, 1, 2, 3, 4, 5, 6, 7, 8, 9, 10, 1, 2, 3, 4, 5, 6, 7, 8, 9, 10, 1, 2, 3, 4, 5, 6, 7, 8, 9, 10, 1, 2, 3, 4, 5, 6, 7, 8, 9, 10],
        "supp": ["VC", "VC", "VC", "VC", "VC", "VC", "VC", "VC", "VC", "VC", "VC", "VC", "VC", "VC", "VC", "VC", "VC", "VC", "VC", "VC", "VC", "VC", "VC", "VC", "VC", "VC", "VC", "VC", "VC", "VC", "OJ", "OJ", "OJ", "OJ", "OJ", "OJ", "OJ", "OJ", "OJ", "OJ", "OJ", "OJ", "OJ", "OJ", "OJ", "OJ", "OJ", "OJ", "OJ", "OJ", "OJ", "OJ", "OJ", "OJ", "OJ", "OJ", "OJ", "OJ", "OJ", "OJ"]
      },
      "y": {
        "data": [
          [4.2, 11.5, 7.3, 5.8, 6.4, 10, 11.2, 11.2, 5.2, 7, 16.5, 16.5, 15.2, 17.3, 22.5, 17.3, 13.6, 14.5, 18.8, 15.5, 23.6, 18.5, 33.9, 25.5, 26.4, 32.5, 26.7, 21.5, 23.3, 29.5, 15.2, 21.5, 17.6, 9.7, 14.5, 10, 8.2, 9.4, 16.5, 9.7, 19.7, 23.3, 23.6, 26.4, 20, 25.2, 25.8, 21.2, 14.5, 27.3, 25.5, 26.4, 22.4, 24.5, 24.8, 30.9, 26.4, 27.3, 29.4, 23]
        ],
        "smps": ["Var1", "Var2", "Var3", "Var4", "Var5", "Var6", "Var7", "Var8", "Var9", "Var10", "Var11", "Var12", "Var13", "Var14", "Var15", "Var16", "Var17", "Var18", "Var19", "Var20", "Var21", "Var22", "Var23", "Var24", "Var25", "Var26", "Var27", "Var28", "Var29", "Var30", "Var31", "Var32", "Var33", "Var34", "Var35", "Var36", "Var37", "Var38", "Var39", "Var40", "Var41", "Var42", "Var43", "Var44", "Var45", "Var46", "Var47", "Var48", "Var49", "Var50", "Var51", "Var52", "Var53", "Var54", "Var55", "Var56", "Var57", "Var58", "Var59", "Var60"],
        "vars": ["len"]
      }
    },
    config = {
      "boxplotColor": "#00AFBB",
      "decorations": {
        "marker": [
          {
            "color": "black",
            "group": 0,
            "group2": 1,
            "scope": ["OJ"],
            "text": "<0.0002",
            "type": "pwc",
            "variable": "len",
            "ymax": 35.385,
            "ymin": 34.494
          },
          {
            "color": "black",
            "group": 0,
            "group2": 2,
            "scope": ["OJ"],
            "text": "<0.0001",
            "type": "pwc",
            "variable": "len",
            "ymax": 38.949,
            "ymin": 38.058
          },
          {
            "color": "black",
            "group": 1,
            "group2": 2,
            "scope": ["OJ"],
            "text": "0.039",
            "type": "pwc",
            "variable": "len",
            "ymax": 42.513,
            "ymin": 41.622
          },
          {
            "color": "black",
            "group": 0,
            "group2": 1,
            "scope": ["VC"],
            "text": "<0.0001",
            "type": "pwc",
            "variable": "len",
            "ymax": 35.385,
            "ymin": 34.494
          },
          {
            "color": "black",
            "group": 0,
            "group2": 2,
            "scope": ["VC"],
            "text": "<0.0001",
            "type": "pwc",
            "variable": "len",
            "ymax": 38.949,
            "ymin": 38.058
          },
          {
            "color": "black",
            "group": 1,
            "group2": 2,
            "scope": ["VC"],
            "text": "<0.0001",
            "type": "pwc",
            "variable": "len",
            "ymax": 42.513,
            "ymin": 41.622
          }
        ]
      },
      "graphOrientation": "vertical",
      "graphType": "Boxplot",
      "groupingFactors": ["dose"],
      "layoutTopology": "1X2",
      "segregateSamplesBy": ["supp"],
      "smpTextRotate": 90,
      "smpTitle": "len",
      "sortOnGrouping": "ascending",
      "theme": "GGPlot",
      "xAxis": ["len"]
    },
    width = 600,
    height = 600
  )
)
using CanvasXpress

canvasxpress(Dict(
  "x" => Dict(
    "dose" => ["0.5", "0.5", "0.5", "0.5", "0.5", "0.5", "0.5", "0.5", "0.5", "0.5", "1", "1", "1", "1", "1", "1", "1", "1", "1", "1", "2", "2", "2", "2", "2", "2", "2", "2", "2", "2", "0.5", "0.5", "0.5", "0.5", "0.5", "0.5", "0.5", "0.5", "0.5", "0.5", "1", "1", "1", "1", "1", "1", "1", "1", "1", "1", "2", "2", "2", "2", "2", "2", "2", "2", "2", "2"],
    "order" => [1, 2, 3, 4, 5, 6, 7, 8, 9, 10, 1, 2, 3, 4, 5, 6, 7, 8, 9, 10, 1, 2, 3, 4, 5, 6, 7, 8, 9, 10, 1, 2, 3, 4, 5, 6, 7, 8, 9, 10, 1, 2, 3, 4, 5, 6, 7, 8, 9, 10, 1, 2, 3, 4, 5, 6, 7, 8, 9, 10],
    "supp" => ["VC", "VC", "VC", "VC", "VC", "VC", "VC", "VC", "VC", "VC", "VC", "VC", "VC", "VC", "VC", "VC", "VC", "VC", "VC", "VC", "VC", "VC", "VC", "VC", "VC", "VC", "VC", "VC", "VC", "VC", "OJ", "OJ", "OJ", "OJ", "OJ", "OJ", "OJ", "OJ", "OJ", "OJ", "OJ", "OJ", "OJ", "OJ", "OJ", "OJ", "OJ", "OJ", "OJ", "OJ", "OJ", "OJ", "OJ", "OJ", "OJ", "OJ", "OJ", "OJ", "OJ", "OJ"]
  ),
  "y" => Dict(
    "data" => [
      [4.2, 11.5, 7.3, 5.8, 6.4, 10, 11.2, 11.2, 5.2, 7, 16.5, 16.5, 15.2, 17.3, 22.5, 17.3, 13.6, 14.5, 18.8, 15.5, 23.6, 18.5, 33.9, 25.5, 26.4, 32.5, 26.7, 21.5, 23.3, 29.5, 15.2, 21.5, 17.6, 9.7, 14.5, 10, 8.2, 9.4, 16.5, 9.7, 19.7, 23.3, 23.6, 26.4, 20, 25.2, 25.8, 21.2, 14.5, 27.3, 25.5, 26.4, 22.4, 24.5, 24.8, 30.9, 26.4, 27.3, 29.4, 23]
    ],
    "smps" => ["Var1", "Var2", "Var3", "Var4", "Var5", "Var6", "Var7", "Var8", "Var9", "Var10", "Var11", "Var12", "Var13", "Var14", "Var15", "Var16", "Var17", "Var18", "Var19", "Var20", "Var21", "Var22", "Var23", "Var24", "Var25", "Var26", "Var27", "Var28", "Var29", "Var30", "Var31", "Var32", "Var33", "Var34", "Var35", "Var36", "Var37", "Var38", "Var39", "Var40", "Var41", "Var42", "Var43", "Var44", "Var45", "Var46", "Var47", "Var48", "Var49", "Var50", "Var51", "Var52", "Var53", "Var54", "Var55", "Var56", "Var57", "Var58", "Var59", "Var60"],
    "vars" => ["len"]
  )
);
  boxplotColor = "#00AFBB",
  decorations = Dict(
    "marker" => [
      Dict(
        "color" => "black",
        "group" => 0,
        "group2" => 1,
        "scope" => ["OJ"],
        "text" => "<0.0002",
        "type" => "pwc",
        "variable" => "len",
        "ymax" => 35.385,
        "ymin" => 34.494
      ),
      Dict(
        "color" => "black",
        "group" => 0,
        "group2" => 2,
        "scope" => ["OJ"],
        "text" => "<0.0001",
        "type" => "pwc",
        "variable" => "len",
        "ymax" => 38.949,
        "ymin" => 38.058
      ),
      Dict(
        "color" => "black",
        "group" => 1,
        "group2" => 2,
        "scope" => ["OJ"],
        "text" => "0.039",
        "type" => "pwc",
        "variable" => "len",
        "ymax" => 42.513,
        "ymin" => 41.622
      ),
      Dict(
        "color" => "black",
        "group" => 0,
        "group2" => 1,
        "scope" => ["VC"],
        "text" => "<0.0001",
        "type" => "pwc",
        "variable" => "len",
        "ymax" => 35.385,
        "ymin" => 34.494
      ),
      Dict(
        "color" => "black",
        "group" => 0,
        "group2" => 2,
        "scope" => ["VC"],
        "text" => "<0.0001",
        "type" => "pwc",
        "variable" => "len",
        "ymax" => 38.949,
        "ymin" => 38.058
      ),
      Dict(
        "color" => "black",
        "group" => 1,
        "group2" => 2,
        "scope" => ["VC"],
        "text" => "<0.0001",
        "type" => "pwc",
        "variable" => "len",
        "ymax" => 42.513,
        "ymin" => 41.622
      )
    ]
  ),
  graphOrientation = "vertical",
  graphType = "Boxplot",
  groupingFactors = ["dose"],
  layoutTopology = "1X2",
  segregateSamplesBy = ["supp"],
  smpTextRotate = 90,
  smpTitle = "len",
  sortOnGrouping = "ascending",
  theme = "GGPlot",
  xAxis = ["len"]
)