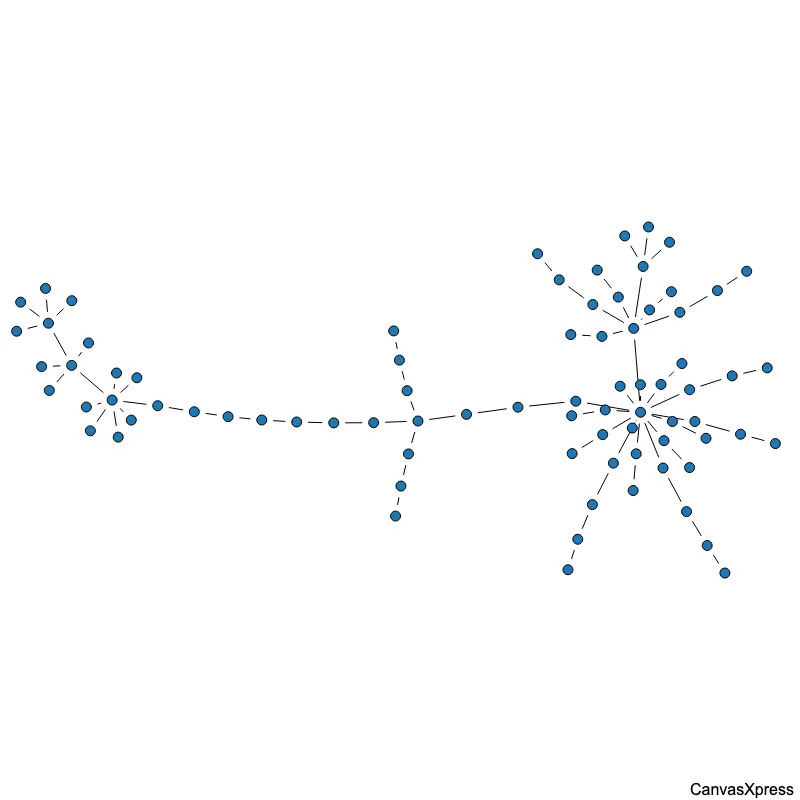
Encode a Categorical Edge Attribute as Line Style
Network graphs are powerful visualizations of relationships within datasets. Nodes represent entities, and edges show connections between them. Applications range from social networks and infrastructure mapping to biological systems and cybersecurity analysis. Understanding network graph properties like centrality and clustering reveals valuable insights. Analyzing network graphs helps identify key players, vulnerabilities, and community structures. Tools and algorithms exist for creating, visualizing, and analyzing these graphs, providing crucial data-driven insights across many fields. From identifying influential figures to optimizing infrastructure, network graphs offer a versatile approach to complex data representation.


<html>

  <head>
    <!-- Include the CanvasXpress library in your HTML file -->
    <link rel="stylesheet" href="https://www.canvasxpress.org/dist/canvasXpress.css" type="text/css"/>
    <script src="https://www.canvasxpress.org/dist/canvasXpress.min.js"></script>
  </head>

  <body>

    <!-- Create a canvas element for the chart with the desired dimensions -->
    <div>
      <canvas id="canvasId" width="600" height="600"></canvas>
    </div>


    <!-- Create a script to initialize the chart -->
    <script>

      // Create the data for the graph
      var data = {
         "nodes" : [
            {
               "id" : "STAT1",
               "role" : "TF"
            },
            {
               "id" : "IRF1",
               "role" : "TF"
            },
            {
               "id" : "NFKB1",
               "role" : "TF"
            },
            {
               "id" : "GBP1",
               "role" : "target"
            },
            {
               "id" : "CXCL10",
               "role" : "target"
            },
            {
               "id" : "IDO1",
               "role" : "target"
            },
            {
               "id" : "TNF",
               "role" : "target"
            },
            {
               "id" : "IL6",
               "role" : "target"
            },
            {
               "id" : "SOCS1",
               "role" : "target"
            },
            {
               "id" : "MYC",
               "role" : "target"
            }
         ],
         "edges" : [
            {
               "id1" : "STAT1",
               "id2" : "GBP1",
               "sign" : "activation",
               "coef" : 0.9,
               "evidence" : "eqtl"
            },
            {
               "id1" : "STAT1",
               "id2" : "CXCL10",
               "sign" : "activation",
               "coef" : 0.8,
               "evidence" : "chipseq"
            },
            {
               "id1" : "STAT1",
               "id2" : "IDO1",
               "sign" : "activation",
               "coef" : 0.6,
               "evidence" : "eqtl"
            },
            {
               "id1" : "IRF1",
               "id2" : "GBP1",
               "sign" : "activation",
               "coef" : 0.7,
               "evidence" : "chipseq"
            },
            {
               "id1" : "IRF1",
               "id2" : "CXCL10",
               "sign" : "activation",
               "coef" : 0.55,
               "evidence" : "eqtl"
            },
            {
               "id1" : "IRF1",
               "id2" : "MYC",
               "sign" : "repression",
               "coef" : 0.65,
               "evidence" : "eqtl"
            },
            {
               "id1" : "NFKB1",
               "id2" : "TNF",
               "sign" : "activation",
               "coef" : 0.85,
               "evidence" : "chipseq"
            },
            {
               "id1" : "NFKB1",
               "id2" : "IL6",
               "sign" : "activation",
               "coef" : 0.75,
               "evidence" : "chipseq"
            },
            {
               "id1" : "SOCS1",
               "id2" : "STAT1",
               "sign" : "repression",
               "coef" : 0.6,
               "evidence" : "eqtl"
            },
            {
               "id1" : "SOCS1",
               "id2" : "NFKB1",
               "sign" : "repression",
               "coef" : 0.5,
               "evidence" : "chipseq"
            },
            {
               "id1" : "MYC",
               "id2" : "IL6",
               "sign" : "repression",
               "coef" : 0.45,
               "evidence" : "eqtl"
            }
         ]
      }

      // Create the configuration for the graph
      var config = {
         "graphType" : "Network",
         "networkLayoutType" : "forceDirected",
         "colorEdgeBy" : "sign",
         "sizeEdgeBy" : "coef",
         "lineEdgeBy" : "evidence",
         "colorKey" : {
            "sign" : {
               "activation" : "#2c7fb8",
               "repression" : "#d95f0e"
            }
         },
         "lineKey" : {
            "evidence" : {
               "eqtl" : "dashed",
               "chipseq" : "solid"
            }
         },
         "nodeFontColor" : "rgb(30,30,30)",
         "edgeThickness" : 2,
         "showAnimation" : true,
         "title" : "Gene Regulatory Network - Edge Line Style by Evidence"
      }

      // Event used to create graph (optional)
      var events = false

            // Call the CanvasXpress function to create the graph
      var cX = new CanvasXpress("canvasId", data, config, events);

    </script>

  </body>

</html>
library(canvasXpress)
nodes=read.table("https://www.canvasxpress.org/data/r/cX-network36-nodes.txt", header=TRUE, sep="\t", quote="", fill=TRUE, check.names=FALSE, stringsAsFactors=FALSE)
edges=read.table("https://www.canvasxpress.org/data/r/cX-network36-edges.txt", header=TRUE, sep="\t", quote="", fill=TRUE, check.names=FALSE, stringsAsFactors=FALSE)
canvasXpress(
nodeData=nodes,
edgeData=edges,
colorEdgeBy="sign",
colorKey=list(sign=list(activation="#2c7fb8", repression="#d95f0e")),
edgeThickness=2,
graphType="Network",
lineEdgeBy="evidence",
lineKey=list(evidence=list(chipseq="solid", eqtl="dashed")),
networkLayoutType="forceDirected",
nodeFontColor="rgb(30,30,30)",
showAnimation=TRUE,
sizeEdgeBy="coef",
title="Gene Regulatory Network - Edge Line Style by Evidence"
)
from canvasxpress.canvas import CanvasXpress
from canvasxpress.plot import show_in_browser

if __name__ == "__main__":
  # Define the chart with its data and configuration
  chart: CanvasXpress = CanvasXpress(
    render_to = "network36",
    data = {
      "nodes": [
        {
          "id": "STAT1",
          "role": "TF"
        },
        {
          "id": "IRF1",
          "role": "TF"
        },
        {
          "id": "NFKB1",
          "role": "TF"
        },
        {
          "id": "GBP1",
          "role": "target"
        },
        {
          "id": "CXCL10",
          "role": "target"
        },
        {
          "id": "IDO1",
          "role": "target"
        },
        {
          "id": "TNF",
          "role": "target"
        },
        {
          "id": "IL6",
          "role": "target"
        },
        {
          "id": "SOCS1",
          "role": "target"
        },
        {
          "id": "MYC",
          "role": "target"
        }
      ],
      "edges": [
        {
          "id1": "STAT1",
          "id2": "GBP1",
          "sign": "activation",
          "coef": 0.9,
          "evidence": "eqtl"
        },
        {
          "id1": "STAT1",
          "id2": "CXCL10",
          "sign": "activation",
          "coef": 0.8,
          "evidence": "chipseq"
        },
        {
          "id1": "STAT1",
          "id2": "IDO1",
          "sign": "activation",
          "coef": 0.6,
          "evidence": "eqtl"
        },
        {
          "id1": "IRF1",
          "id2": "GBP1",
          "sign": "activation",
          "coef": 0.7,
          "evidence": "chipseq"
        },
        {
          "id1": "IRF1",
          "id2": "CXCL10",
          "sign": "activation",
          "coef": 0.55,
          "evidence": "eqtl"
        },
        {
          "id1": "IRF1",
          "id2": "MYC",
          "sign": "repression",
          "coef": 0.65,
          "evidence": "eqtl"
        },
        {
          "id1": "NFKB1",
          "id2": "TNF",
          "sign": "activation",
          "coef": 0.85,
          "evidence": "chipseq"
        },
        {
          "id1": "NFKB1",
          "id2": "IL6",
          "sign": "activation",
          "coef": 0.75,
          "evidence": "chipseq"
        },
        {
          "id1": "SOCS1",
          "id2": "STAT1",
          "sign": "repression",
          "coef": 0.6,
          "evidence": "eqtl"
        },
        {
          "id1": "SOCS1",
          "id2": "NFKB1",
          "sign": "repression",
          "coef": 0.5,
          "evidence": "chipseq"
        },
        {
          "id1": "MYC",
          "id2": "IL6",
          "sign": "repression",
          "coef": 0.45,
          "evidence": "eqtl"
        }
      ]
    },
    config = {
      "graphType": "Network",
      "networkLayoutType": "forceDirected",
      "colorEdgeBy": "sign",
      "sizeEdgeBy": "coef",
      "lineEdgeBy": "evidence",
      "colorKey": {
        "sign": {
          "activation": "#2c7fb8",
          "repression": "#d95f0e"
        }
      },
      "lineKey": {
        "evidence": {
          "eqtl": "dashed",
          "chipseq": "solid"
        }
      },
      "nodeFontColor": "rgb(30,30,30)",
      "edgeThickness": 2,
      "showAnimation": True,
      "title": "Gene Regulatory Network - Edge Line Style by Evidence"
    },
    width = 600,
    height = 600
  )

  # Display the chart in its own Web page
  show_in_browser(chart)

from canvasxpress.canvas import CanvasXpress
from canvasxpress.plot import graph

graph(
  CanvasXpress(
    render_to = "network36",
    data = {
      "nodes": [
        {
          "id": "STAT1",
          "role": "TF"
        },
        {
          "id": "IRF1",
          "role": "TF"
        },
        {
          "id": "NFKB1",
          "role": "TF"
        },
        {
          "id": "GBP1",
          "role": "target"
        },
        {
          "id": "CXCL10",
          "role": "target"
        },
        {
          "id": "IDO1",
          "role": "target"
        },
        {
          "id": "TNF",
          "role": "target"
        },
        {
          "id": "IL6",
          "role": "target"
        },
        {
          "id": "SOCS1",
          "role": "target"
        },
        {
          "id": "MYC",
          "role": "target"
        }
      ],
      "edges": [
        {
          "id1": "STAT1",
          "id2": "GBP1",
          "sign": "activation",
          "coef": 0.9,
          "evidence": "eqtl"
        },
        {
          "id1": "STAT1",
          "id2": "CXCL10",
          "sign": "activation",
          "coef": 0.8,
          "evidence": "chipseq"
        },
        {
          "id1": "STAT1",
          "id2": "IDO1",
          "sign": "activation",
          "coef": 0.6,
          "evidence": "eqtl"
        },
        {
          "id1": "IRF1",
          "id2": "GBP1",
          "sign": "activation",
          "coef": 0.7,
          "evidence": "chipseq"
        },
        {
          "id1": "IRF1",
          "id2": "CXCL10",
          "sign": "activation",
          "coef": 0.55,
          "evidence": "eqtl"
        },
        {
          "id1": "IRF1",
          "id2": "MYC",
          "sign": "repression",
          "coef": 0.65,
          "evidence": "eqtl"
        },
        {
          "id1": "NFKB1",
          "id2": "TNF",
          "sign": "activation",
          "coef": 0.85,
          "evidence": "chipseq"
        },
        {
          "id1": "NFKB1",
          "id2": "IL6",
          "sign": "activation",
          "coef": 0.75,
          "evidence": "chipseq"
        },
        {
          "id1": "SOCS1",
          "id2": "STAT1",
          "sign": "repression",
          "coef": 0.6,
          "evidence": "eqtl"
        },
        {
          "id1": "SOCS1",
          "id2": "NFKB1",
          "sign": "repression",
          "coef": 0.5,
          "evidence": "chipseq"
        },
        {
          "id1": "MYC",
          "id2": "IL6",
          "sign": "repression",
          "coef": 0.45,
          "evidence": "eqtl"
        }
      ]
    },
    config = {
      "graphType": "Network",
      "networkLayoutType": "forceDirected",
      "colorEdgeBy": "sign",
      "sizeEdgeBy": "coef",
      "lineEdgeBy": "evidence",
      "colorKey": {
        "sign": {
          "activation": "#2c7fb8",
          "repression": "#d95f0e"
        }
      },
      "lineKey": {
        "evidence": {
          "eqtl": "dashed",
          "chipseq": "solid"
        }
      },
      "nodeFontColor": "rgb(30,30,30)",
      "edgeThickness": 2,
      "showAnimation": True,
      "title": "Gene Regulatory Network - Edge Line Style by Evidence"
    },
    width = 600,
    height = 600
  )
)